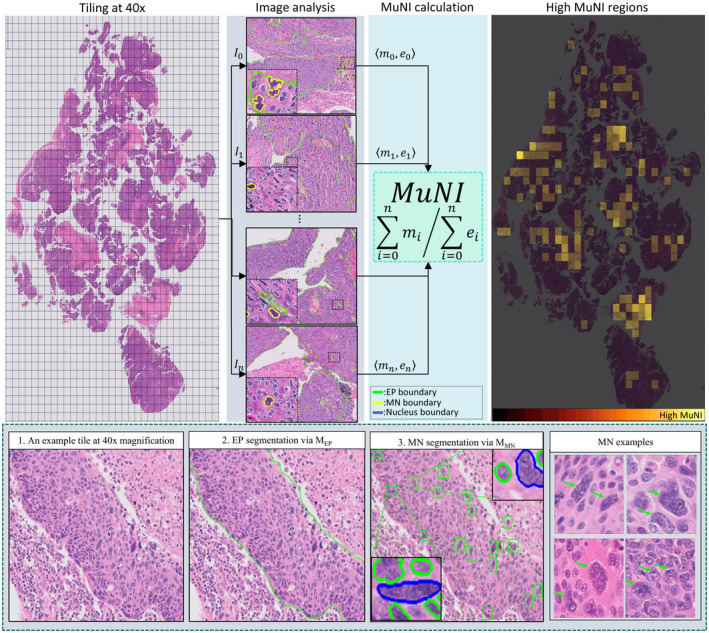
FIGURE 1.

Overall schema of the multinucleation index (MuNI) calculation for a whole slide image (WSI). Epithelial regions and multinucleation (MN) events in every tile were detected using MEP and MMN. After that, the total numbers of epithelial (EP) and MN cells were counted, depicted as m i and e i , respectively, and their ratio was defined as MuNI for the WSI. The last column illustrates MuNI of every tile overlaid as a heatmap on the image. The second row depicts the overall schema of the MN detection from an example image tile. (2) Epithelial regions in the tile were segmented by MEP, shown by green boundaries. (3) MN cells were detected by MMN. Two example MNs automatically detected by MMN are zoomed in for better visualization. The MNs and epithelial cells are shown in blue and green colors, respectively. The last column of the second row illustrates high‐power fields of four images with multinucleated tumor cells, illustrated by green arrows.
