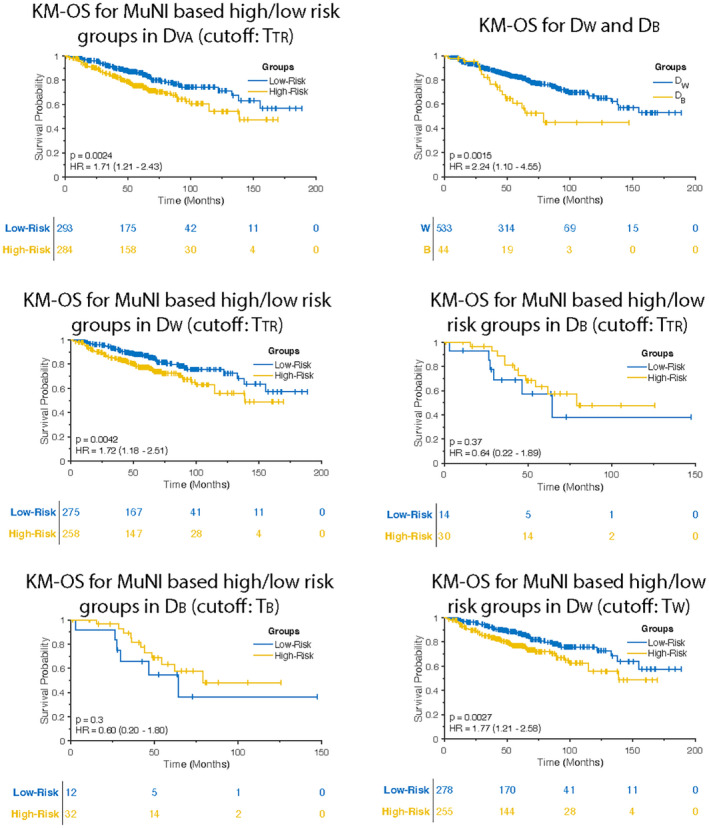
FIGURE 2.

Kaplan–Meier (KM) overall survival (OS) curves in DVA. (A) OS of multinucleation index (MuNI)‐defined high and low‐risk groups using TTR was found statistically significantly different. (B) OS of DB was found statistically significantly shorter than OS of DW. Difference in MuNI could explain the shorter survival of DB patients. Survival differences between the two racial categories could be a factor of histological differences. OS of MuNI‐defined high‐ and low‐risk groups using TTR was statistically significantly different in (C) DW but not in (D) DB. (E) TB yields statistically insignificant separation for DB (p = .3; HR, 0.60; 95% CI, 0.20–1.80). (F) KM OS curve obtained by using TW indicates improved risk stratification for DW.
