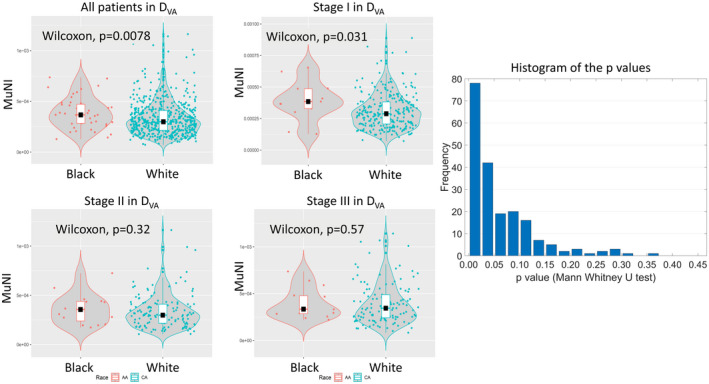
FIGURE 4.

Comparison of Black and White patients. Violin plots show multinucleation index measurements for Black and White human papillomavirus–associated oropharyngeal squamous cell carcinoma patients. (A) All patients in DVA, AJCC 8th edition (B) stage I alone, (C) stage II alone, and (D) stage III alone. (E) The histogram of the p values obtained after applying Mann–Whitney U testing 200 times illustrates the statistical differences between randomly selected subsets of DW and the entire DB. The box plots inside the violin plots demonstrate the median, first, and third quartiles of distributions.
