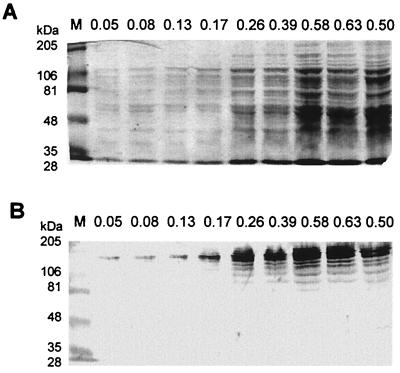
FIG. 2.
Expression of SpuA during different growth phases. (A) Polyacrylamide gel electrophoresis of whole-cell extracts from S. pneumoniae strain 3.B harvested from the same culture as the optical density at 621 nm increased. The gel was Coomassie brilliant blue stained. (B) Western blot analysis of whole-cell extracts (the same as those used for polyacrylamide gel electrophoresis) with anti-SpuA. Lanes M, molecular mass standard sizes shown at left; all other lanes are labeled with optical density values of the culture.

