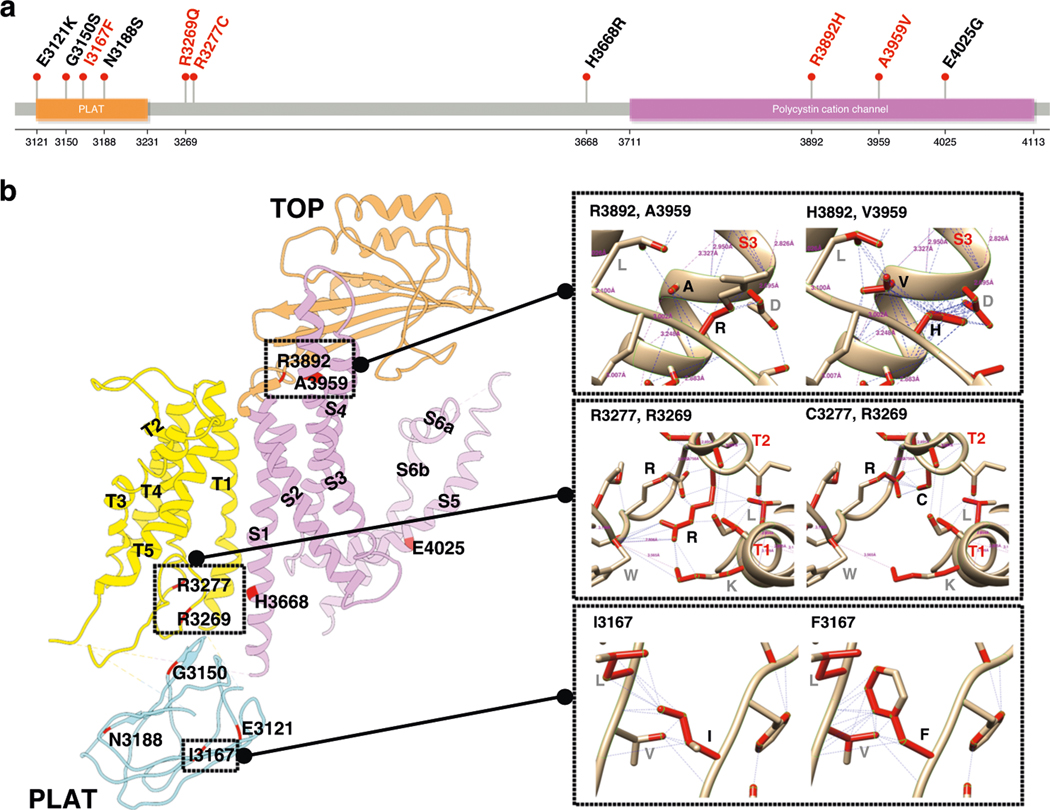
Fig. 2. Structural modeling of PC1 hypomorphic variants.
a Lollipop plot showing missense variants relative to a schematic representation of the PC1 protein. Any position with a variant is indicated by a red circle, the gray bar represents the protein with the different amino acid positions (aa), and colored boxes are specific functional domains. b Ribbon diagram of PC1 showing the representative missense variant residues in red. Dashed boxes correspond local impacts of variants on PC1 structure.14 Interactions are labeled as black dashed lines (pseudobonds), H-bonds are labeled in purple and Interatomic distances are expressed in Å.

