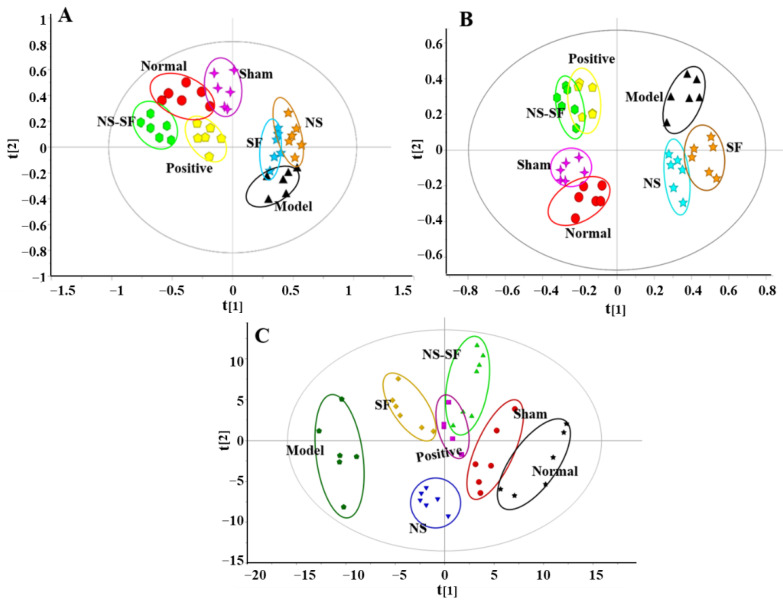
Figure 4.
The PCA score plot of rats in different groups. (A) Positive mode by UPLC−QTOF/MS. (B) Negative mode by UPLC−QTOF/MS (C) 1H NMR. Normal: normal group; Sham: sham−operated group; Model: model group; Positive group: positive control group; NS: total saponins of notoginseng group; SF: total flavonoids of safflower group; NS–SF: the compatibility of NS and SF group.

