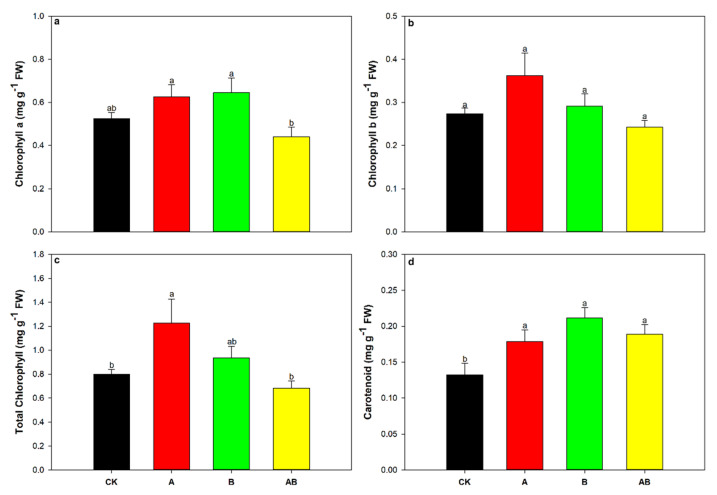
Figure 3.
Effects of AMFs and biochar on (a) chlorophyll a, (b) chlorophyll b, (c) total chlorophyll, and (d) carotenoid contents. Data are means of five replicates ±SEs. Different letters above the columns indicate significant differences according to Duncan’s test at p < 0.05. FW, fresh weight; CK, control; A, arbuscular mycorrhizal fungi; B, biochar; AB, arbuscular mycorrhizal fungi and biochar.

