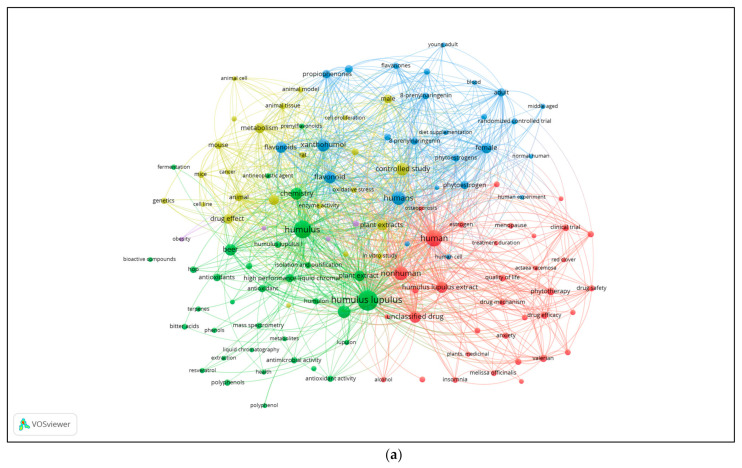
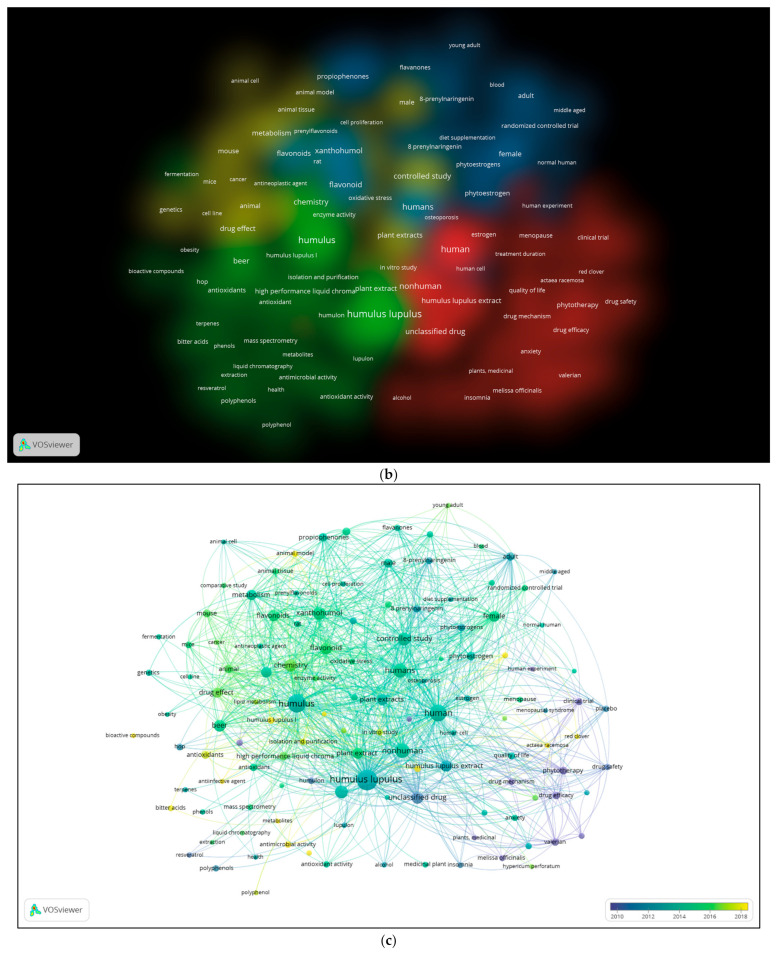
Figure 3.
(a) “Network Visualization” of the keyword co-occurrence network map generated using VOSviewer. (b) “Cluster density” of the map generated in VOSviewer. Each density representing a cluster has a different colour. (c) “Overlay visualization” of the keyword co-occurrence network map generated by VOSviewer. The lighter the yellow colour, the more recent the average year of publication of the keywords represented by the nodes. All maps were generated using VOSviewer software from the results of the search performed in Scopus (until 1 September 2022) and subsequent cleaning of the dataset.


