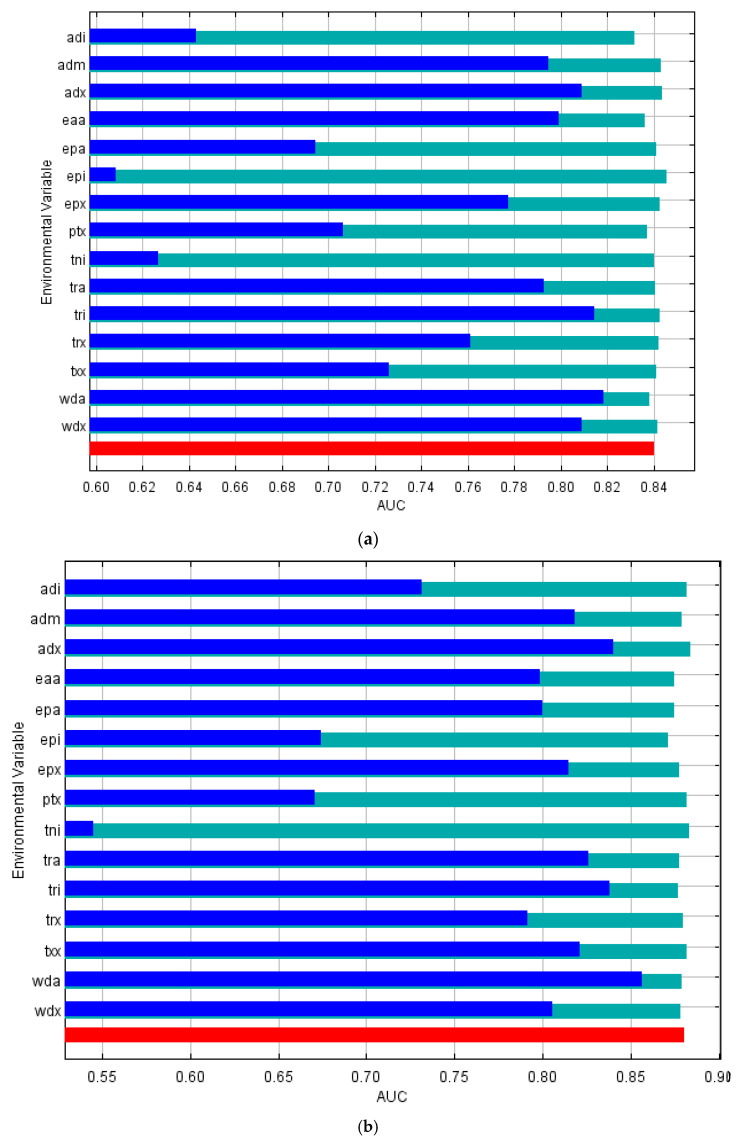
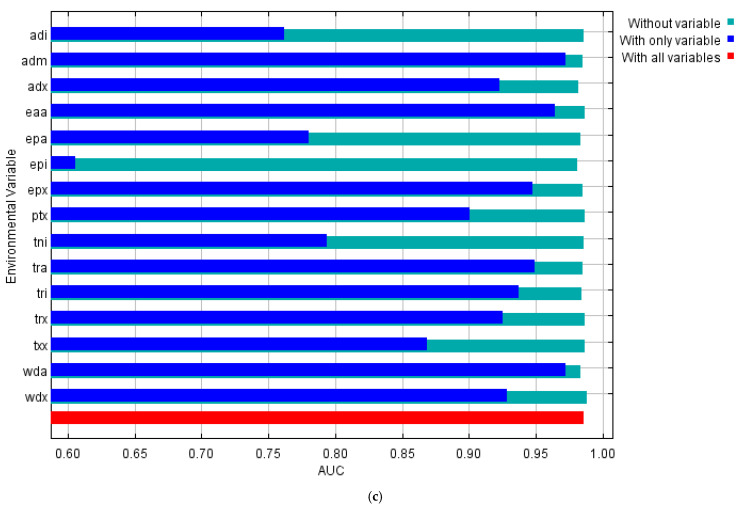
Figure 2.
Jackknife analysis results for (a) Culex annulirostris, (b) Culex quinquefasciatus and (c) Culex sitiens where the blue line represents species distribution model gain when each climate layer is included on its own. Dark blue lines represent model performance when only the climate variable of interest was included, where the longer the dark blue bar, the higher the model gain which suggests the variable contains information critical to mapping that species’ distribution. The red bar represents maximum model performance, while the light green bar represents model performance when that climate variable was excluded. Acronyms for each climate layer are defined as follows: adi (minimum monthly aridity index), adm (mean annual aridity index), adx (maximum monthly aridity index), eaa (annual total actual evapotranspiration, terrain-scaled using MODIS), epa (annual potential evaporation), epi (minimum monthly potential evaporation), epx (maximum monthly potential evaporation), ptx (maximum monthly precipitation), tni (minimum temperature—monthly minimum), tra (annual temperature range), tri (minimum monthly mean diurnal temperature), trx (maximum monthly mean diurnal temperature), txx (maximum temperature—monthly maximum), wda (annual atmospheric water deficit) and wdx (maximum monthly atmospheric water deficit).


