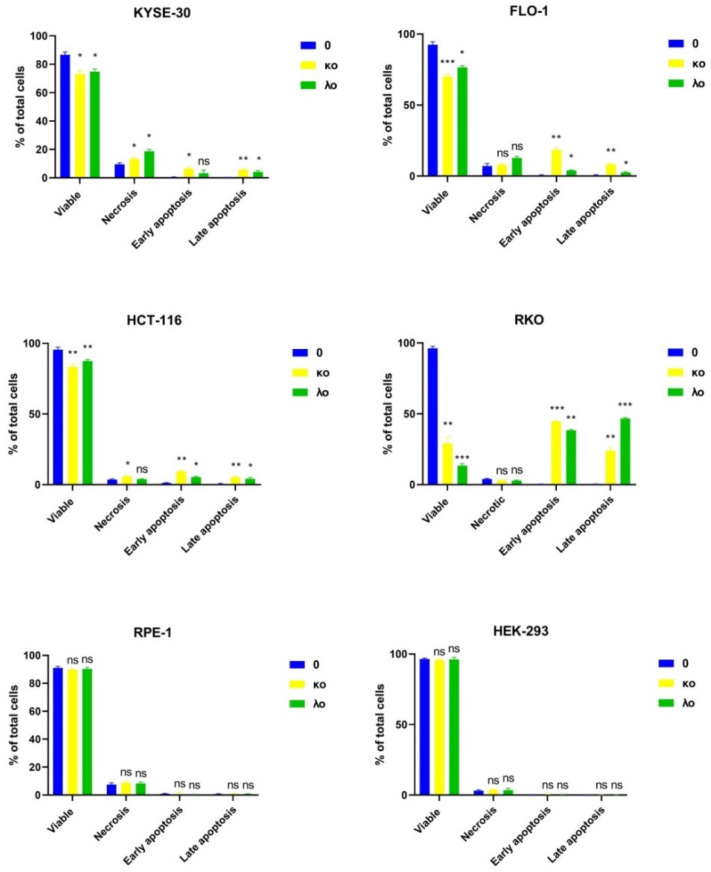
Figure 5.
Apoptosis level in cancer cell lines KYSE-30, FLO-1, HCT-116, RKO and RPE-1 after treatment with κo- and λo-carrageenans for 48 h at IC50 concentrations. The results are expressed as columns and number of cells in % as groups of cells: viable, necrosis, early apoptosis, late apoptosis. * < 0.05, ** < 0.01, *** < 0.001, ns—no significance.

