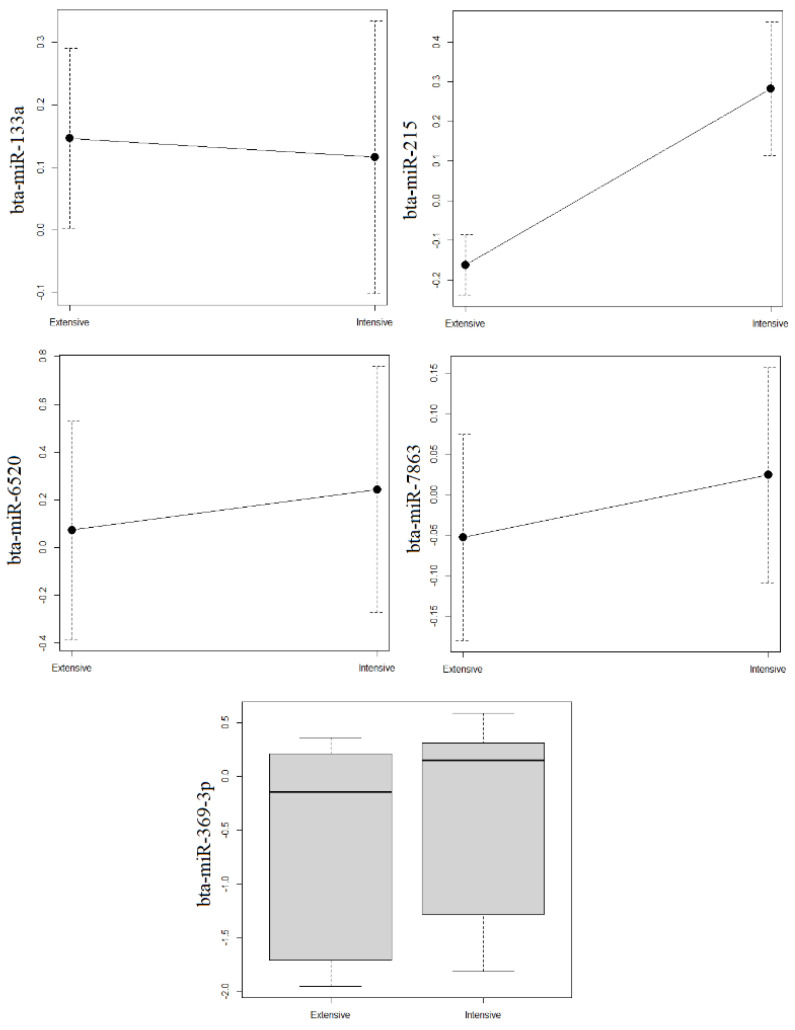
Figure 1.
Average levels of miRNAs estimated by qRT-PCR in fat fractions of milk from extensive and intensive farms. On the X axis, production systems are represented; on the Y axis, average levels of each miRNA are represented. Levels of bta-miR-369-3p showed a skewed distribution, so they are shown using a box-and-whisker plot. The errors bars in the other plots indicate standard deviation.

