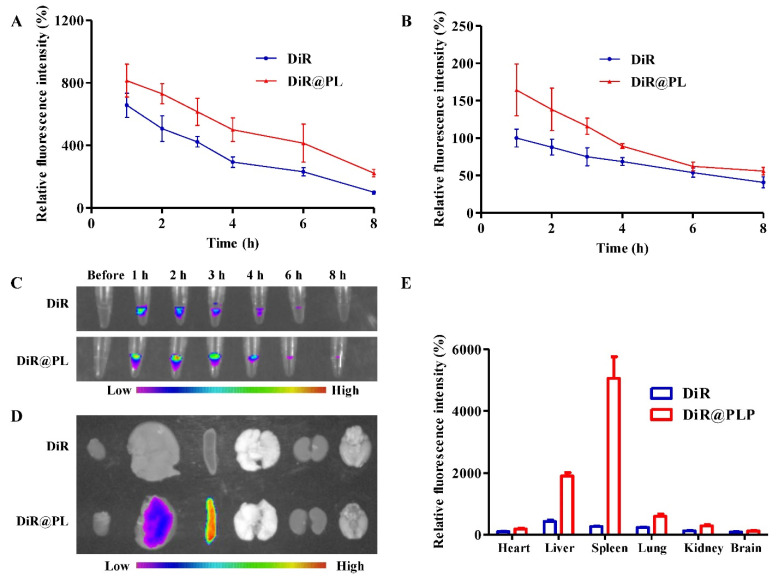
Figure 3.
In vivo distribution of PL in Sprague Dawley rats. (A) Relative fluorescence intensities of plasma samples derived from rats treated with DiR or DiR@PL, detected by a microplate reader. (B) Relative fluorescence intensities of plasma samples derived from rats treated with DiR or DiR@PL, detected by an image system. (C) Representative fluorescence images of plasma samples derived from rats treated with DiR or DiR@PL. (D) Typical ex vivo imaging of major organs at 8 h after injection. (E) Quantified distribution in major organs. Data were presented as the means ± SDs (n = 4).

