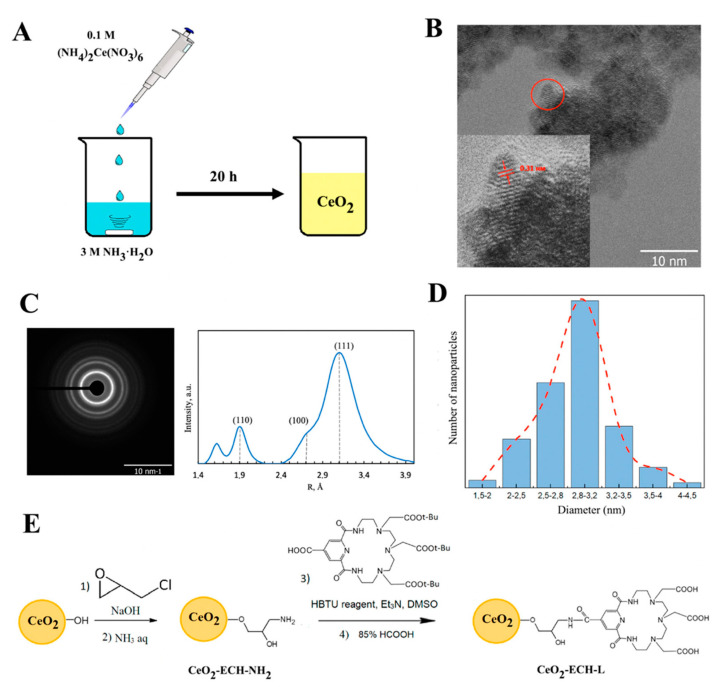
Figure 2.
(A) Synthesis of CeO2 NPs by chemical deposition. (B) TEM image of the CeO2 surface (scale bar = 10 nm). The inset shows a high-resolution TEM image of the as-prepared CeO2 NPs. (C) Selected area electron diffraction (SAED) data. (D) CeO2 NPs size distribution according to TEM data. (E) Schematic showing the modification of cerium nanoparticles with azacrown ether L through the ECH linker.

