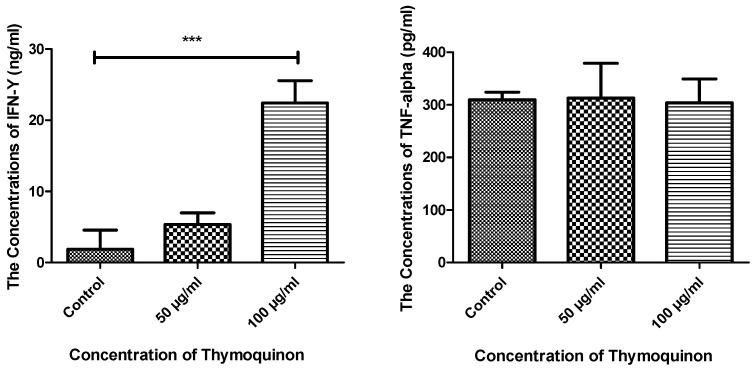
Figure 7.
Comparison of the concentrations of IFN-γ and TNF-α secreted from macrophages in the three groups. The concentrations of both IFN-γ and TNF-α were detected in the different culture conditions as control, 50 µg/mL TQ-treated and 100 µg/mL TQ-treated cells. There was a significant difference in the concentration of IFN-γ secreted from the 100 µg/mL TQ-treated macrophages compared to control (p < 0.0001), while no changes were detected for TNF-α. n = 5. IFN-γ, interferon gamma; TNF-α, tumour necrosis factor alpha. *** p value ≤ 0.001.

