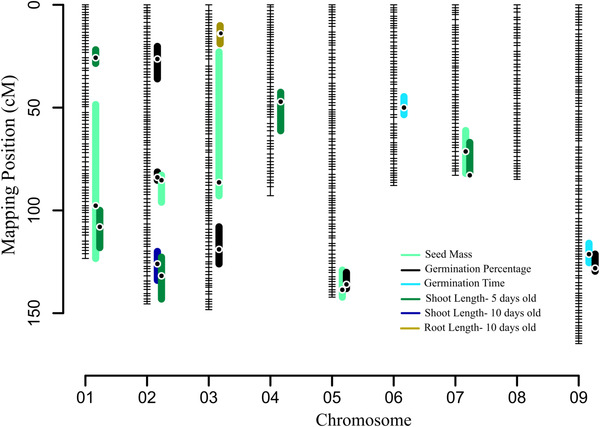
Figure 4.

The RIL genetic linkage map of Panicum hallii generated from HAL2 × FIL2 mapping population. All identified QTL are presented as bars to the right of each linkage group. Each colored bar represents a QTL with length representing the 1.5‐LOD drop confidence intervals. Black dots in the colored bars indicate the position of the QTL based on the maximum LOD score.
