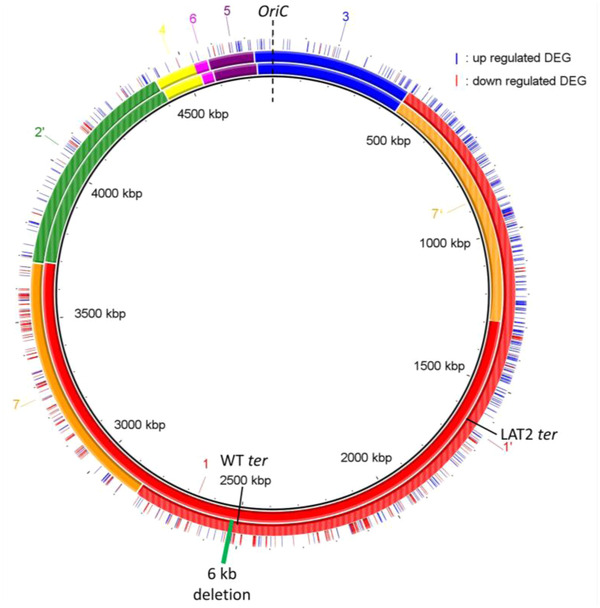
Figure 4.

Gene expression in LAT2. BRIG representation of the WT genome (inner circle, GS 2.66 [17ʹ35642ʹ]) and the LAT2 genome (middle circle, GS21.3 [1ʹ35642ʹ7]). Genome fragments are numbered and shown as colored blocks; inverted fragments are colored with stripes (e.g., green fragment 2) as per (Page et al. 2020). Same origin (oriC, dashed black line) and different termini (ter, solid black lines) of replication are shown for each genome. Outer circle shows location of up‐ (blue line) and down‐ (red line) regulated differentially expressed genes (DEG). Deletion event denoted in LAT2 by solid green rectangle
