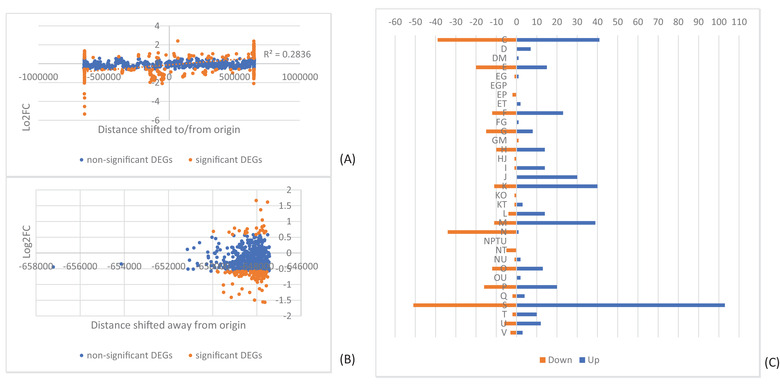
Figure 5.

Impact of genome rearrangement on gene expression in LAT2. Graphical distribution of log2FC against distance a gene has moved toward or away from the origin of replication for LAT2 genes on (A) fragment 1 and (B) fragment 7. Genes colored by nonsignificance (blue) and significance (orange). Linear correlation in panel (A) shown as orange dotted line. (C) Distribution of significant differentially expressed genes (DEGs) from LAT2 across COG categories. Downregulated DEGs shown in orange, upregulated in blue. COG categories: C, Energy production and conversion; D, Cell cycle control, cell division, chromosome partitioning; E, Amino acid transport and metabolism; F, Nucleotide transport and metabolism; G, Carbohydrate transport and metabolism; H, Coenzyme transport and metabolism; I, Lipid transport and metabolism; J, Translation, ribosomal structure, and biogenesis; K, Transcription; L, Replication, recombination and repair; M, Cell wall/membrane/envelope biogenesis; N, Cell motility; O, Posttranslational modification, protein turnover, chaperones; P, Inorganic ion transport and metabolism; Q, Secondary metabolites biosynthesis, transport and catabolism; S, Function unknown; T, Signal transduction mechanisms; U, Intracellular trafficking, secretion, and vesicular transport; V, Defense mechanisms
