
FIGURE 2.
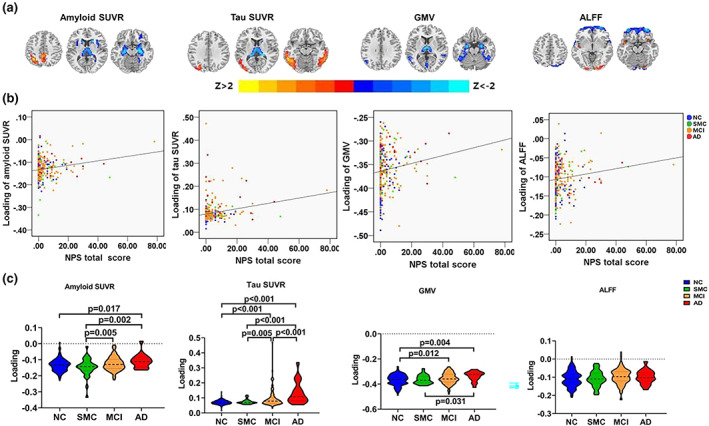
The identified joint component using NPS total score as the reference. (a) The spatial maps are visualized at |Z| > 2, where the positive Z‐values (red regions) mean more amyloid and Tau deposition, higher GMV, and ALFF, and negative Z‐values (blue regions) indicate less amyloid and Tau deposition, decreased GMV and ALFF. (b) The loadings of the identified imaging features and NPS total score were positively correlated (HC: blue dots, SMC: green dots; MCI: orange dots; AD: red dots). (c) Boxplot of the loading parameters of the identified joint component (FDR corrected). AD, Alzheimer's disease; ALFF, fractional amplitude of low frequency fluctuations; GMV, gray matter volume; HC, healthy control; MCI, mild cognitive decline; NPS, neuropsychiatric symptoms; SMC, subjective memory complaint; SUVR, standard uptake value ratios