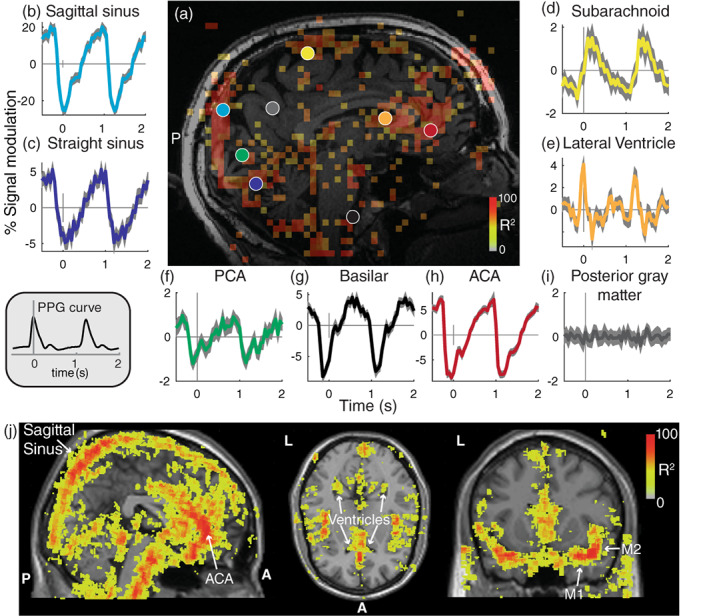
FIGURE 2.

Reliable cardiac‐aligned responses in a single subject. (a) Sagittal slice showing voxels that had highly reliable cardiac aligned responses (R 2 > 50). The colored circles indicate locations of the responses in panels (b–i). The average (±2*SE) cardiac aligned time series are plotted; zero indicates the peak in the photoplethysmography (PPG) responses (gray inset). Cardiac aligned responses are shown for the sagittal sinus (b), straight sinus (c), subarachnoid (d), lateral ventricle (e), posterior cerebral artery (f), basilar artery (g), anterior cerebral artery (h), and posterior gray matter (i). (j) Across all subjects, a map of the reliability of the cardiac aligned responses represented in MNI152 space (without smoothing). Colors overlaid on a standard MNI brain indicate the average reliability (R 2) across subjects for a sagittal, axial and coronal slice. Maps are thresholded and only voxels with an average R 2 > 30 are shown to highlight those areas with reliable modulations. The sagittal sinus, ventricles, anterior cerebral artery (ACA), and M1 and M2 segments of the middle cerebral artery (MCA) are labeled
