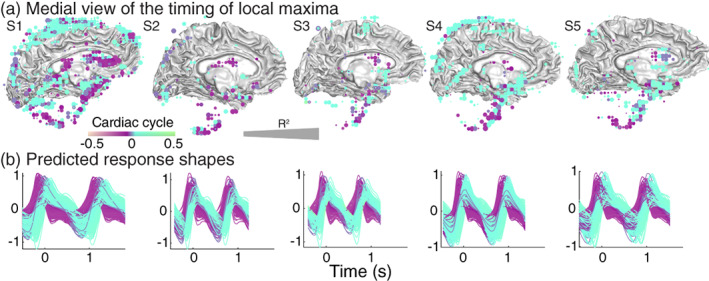
FIGURE 8.

Distribution and timing of the local maxima in the cranium of individual subjects. For all subjects (S1–S5), we calculated the timing of the local maximum of the modeled response in terms of the cardiac cycle for each voxel, with the peak in the photoplethysmography (PPG) located at time zero. (a) Medial view of times of local maxima in voxels with reliable cardiac aligned responses (R 2 > 50) were rendered on the gray/white matter surface. Purple colors indicate peak times before the PPG peak and cyan colors indicate times after the PPG peak. (b) Predicted cardiac aligned response shapes for all displayed voxels as a function of time (s). Colors match the color of the voxels. The following supplemental movies show the dynamic evolution of these cardiac responses Movies S1 and S2
