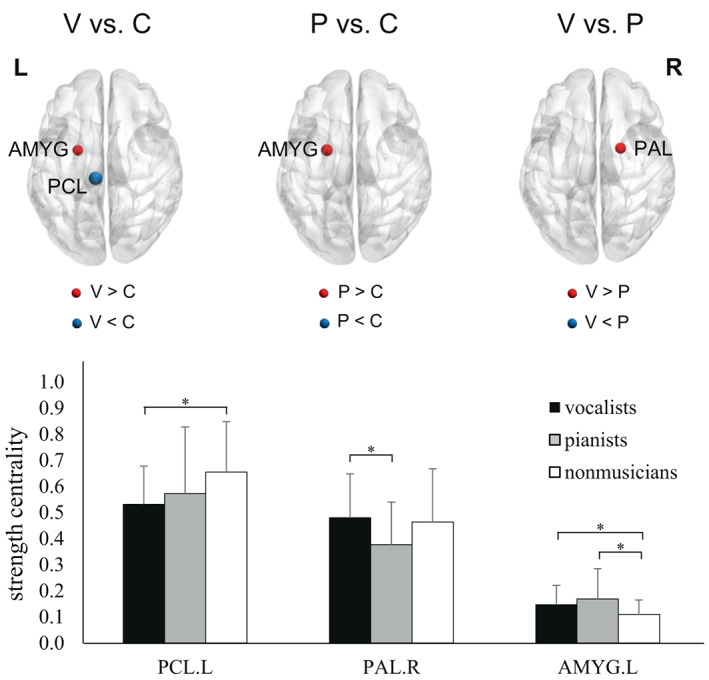
FIGURE 2.

Comparison of strength centrality among the three groups. Note that the size of the sphere indicates the degree of statistical significance between the results from the two groups. The Kruskal‐Wallis tests revealed significant group differences in the left paracentral lobule (PCL; H(2) = 10.135, p = .006), right pallidum (PAL; H(2) = 6.23, p = .044), and left amygdala (AMYG; H(2) = 6.699, p = .035). P, pianists; V, vocalists; C, nonmusicians; L, left; R, right (*FWE‐corrected p < .05; post hoc permutation test using 10,000 iterations)
