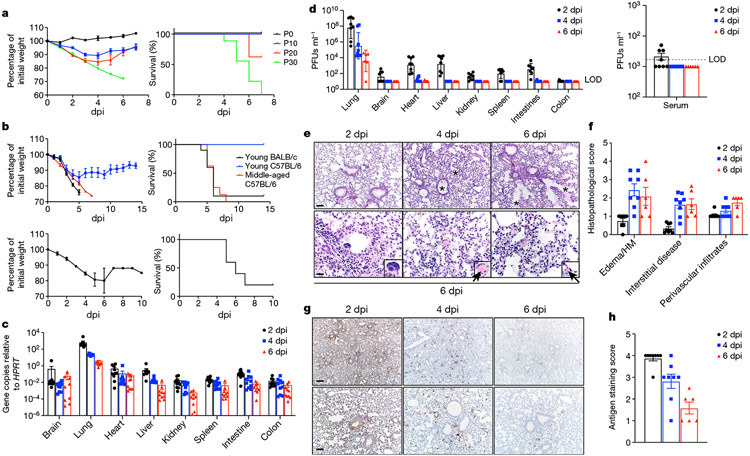
Fig. 1 ∣. Clinical, virological and pathological disease in mice infected with SARS2-N501YMA30.
a, Weight (left) and survival (right) of young BALB/c mice infected with passage (P) 0 (n = 3; 105 PFUs), P10 (n = 8; 9,000 PFUs), P20 (n = 8; 9,000 PFUs) or P30 (n = 9; 5,000 PFUs) SARS-CoV-2. P refers to the number of mouse lung passages. b, Weight (left panels) and survival (right panels) of young BALB/c (n = 10), young C57BL/6 (n = 6) or middle-aged C57BL/6 (n = 8) mice infected with 5,000 PFUs of SARS2-N501YMA30 (upper panel). Weight (left) and survival (right) of middle-aged C57BL/6 (n = 5) mice infected with 5,000 PFUs of BAC-derived SARS2-N501YMA30 (lower panel). Data are representative of two independent experiments. Data in a and b (left) are mean ± s.e.m. c, d, Viral genomic RNA (c) and infectious viral titres (d) at 2, 4 and 6 dpi with 5,000 PFUs of SARS2-N501YMA30 (n = 10 at all time points in c; n = 8 at 2 and 4 dpi, and n = 6 at 6 dpi in d). Serum titres are shown in the right panel of d. LOD, limit of detection. Data in c and d are geometric mean ± geometric s.d. e–h, Lungs from SARS2-N501YMA30-infected mice (n = 8 at 2 and 4 dpi; n = 6 at 6 dpi) were stained with haematoxylin and eosin (H&E) (e) or immunostained for SARS-CoV-2 nucleocapsid (g), and the pathological lesions and staining were quantified (f and h, respectively). e, Infected lungs exhibited airway edema (asterisks, top panels), multinucleated syncytial cells (inset in lower left panel), vascular thrombosis (arrows, insets in lower middle and right insets). Scale bars, 90 μm (top) and 22 μm (bottom); H&E stain. f, Summary scores of lung lesions (n = 8 at 2 and 4 dpi; n = 6 at 6 dpi). HM, hyaline membranes. g, Lungs from SARS2-N501YMA30-infected mice (n = 8 at 2 and 4 dpi; n = 6 at 6 dpi) were immunostained to detect SARS-CoV-2 nucleocapsid protein. Scale bars, 230 μm (top) and 90 μm (bottom). h, Summary scores of nucleocapsid immunostaining of lungs (n = 8 at 2 and 4 dpi; n = 6 at 6 dpi). Data in f and h are mean ± sem.

