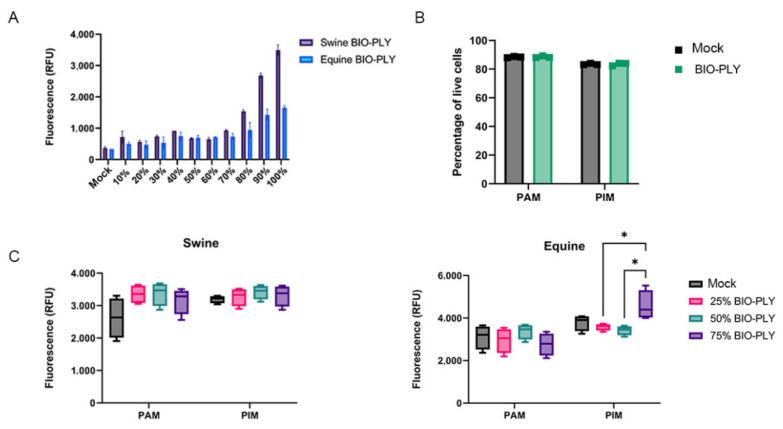
Figure 7.
Cell viability and BIO-PLYTM cytotoxicity in cell line and primary macrophages PAM and PIM. (A) Effect of different BIO-PLYTM concentrations in NPTr cell line using the Promega CellTox green cytotoxicity assay. (B) Effect on the viability of PAM and PIM treated with 50% swine BIO-PLYTM for 24 h measured via flow cytometry and LIVE/DEAD staining. (C) The impact of swine (left) and equine (right) BIO-PLYTM treatment for 48 h in PAM and PIM using the same Promega kit. All experiments were performed using technical duplicates in 4 biological replicates. Results are expressed as relative fluorescence units (RFU) and were analyzed via two-way ANOVA and displayed showing means and standard error of mean (SEM). p-values were expressed using asterisks following APA and Prism standards. * p ≤ 0.05.

