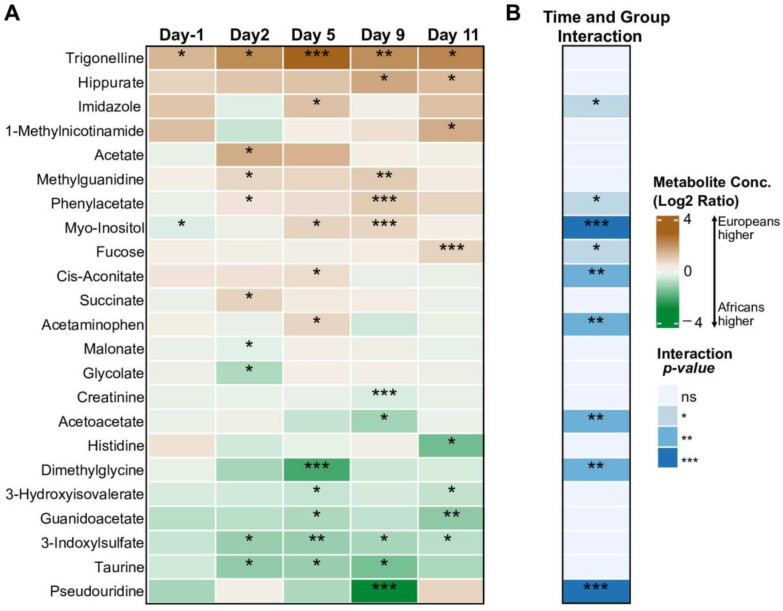
Figure 2.
Changes in urinary metabolites in Europeans and Africans upon Plasmodium falciparum infection. (A) Heatmap showing differentially abundant urinary metabolites between Europeans and Africans on Day-1 (before PfSPZ DVI), and at 2, 5, 9, and 11 days post PfSPZ DVI. Color indicates Log2-ratio of metabolite levels between Europeans and Africans; positive values indicate higher metabolite concentrations in Europeans. (B) Metabolites with differential trajectory of change between the groups in response to the challenge (time and group interaction effect). Statistically significant comparisons are indicated using colors and asterisks, as shown in the legend. * p < 0.05, ** p < 0.01, *** p < 0. 001.

