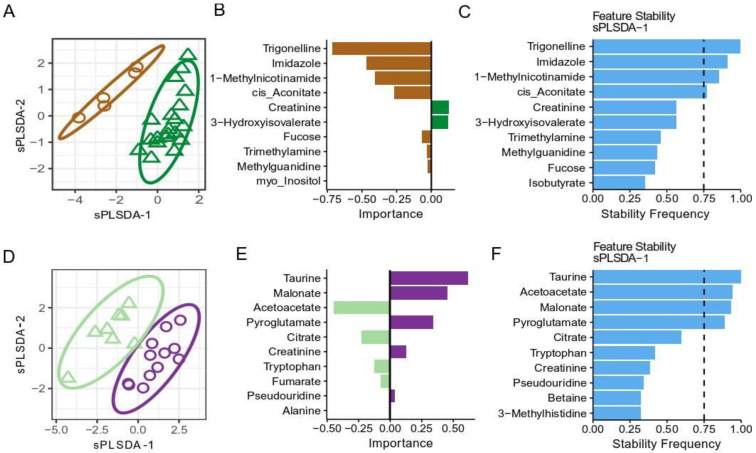
Figure 4.
The differences in urinary metabolites at baseline. Sparse PLS-DA (sPLS-DA) analysis of metabolite concentrations at baseline (at Day 1 before PfSPZ DVI) in (A) Europeans (brown color) and Africans (green color) and as well as in (D) TBS negative (light green color) and TBS positive (purple color) Africans. The following hyperparameters were used for both sPLS-DA models in (A,D): two components, maximum distance, 10 variables per component. Model classification performance was assessed using 5-fold cross-validation. Overall classification error rates for the first and second component for (A) were 28% and 29%, respectively, and for (D) were 25% and 21%, respectively. (B,E) Importance of metabolites in the first sPLS-DA component for (A), and (B), respectively. Color indicates the group in which the metabolite concentration is higher. (C,F) represented the frequencies in which the metabolites were retained over 1000 repeats of 5-fold cross-validation, indicating the reproducibility of the signature.

