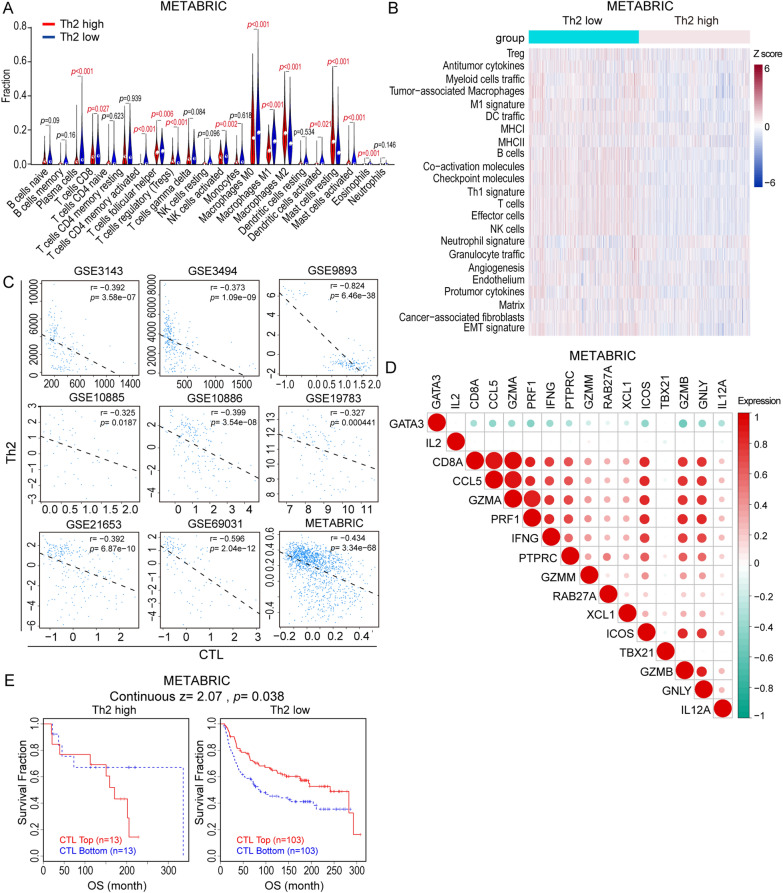
Fig. 1.
Distinct immune profiling in Th2-high and Th2-low breast cancer samples. A The correlation between Th2 cells and 22 types of stromal cells from TME in METABRIC breast cancer database assessed by CIBERSORT (Th2 level divided by GATA3 median level). B Heatmap of METABRIC database samples classified into Th2-high and Th2-low group with unsupervised clustering of the 29 FGES. C Pearson correlation analysis of the relationship between Th2 cell infiltration and CTL infiltration in cancer tissues from TNBC patients based on 9 BRCA datasets. D Correlation between Th2 signature gene (GATA3) expression and T cell function signature genes expression in breast cancer based on METABRIC database. E The Kaplan–Meier survival analysis of METABRIC breast cancer patients in Th2-high and -low groups based on CTL infiltration level. High CTL infiltration, CTL-Top; Low CTL infiltration, CTL-Bottom

