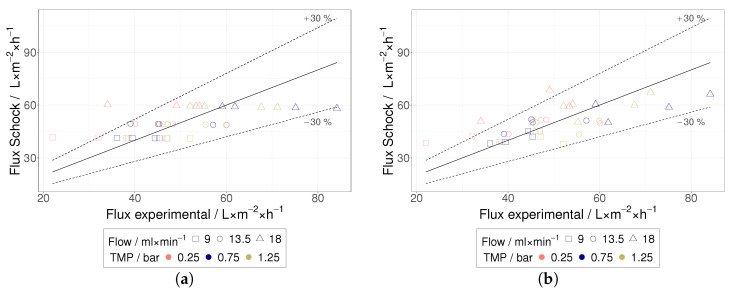
Figure 10.
Experimental flux versus calculated flux according to Schock [24]; as function over u (a) for entire series of tests (1CS) and (b) for each MWCO (4CS). The straight line means a deviation of experimental versus model values by 0%, while the dotted lines show a deviation of %.

