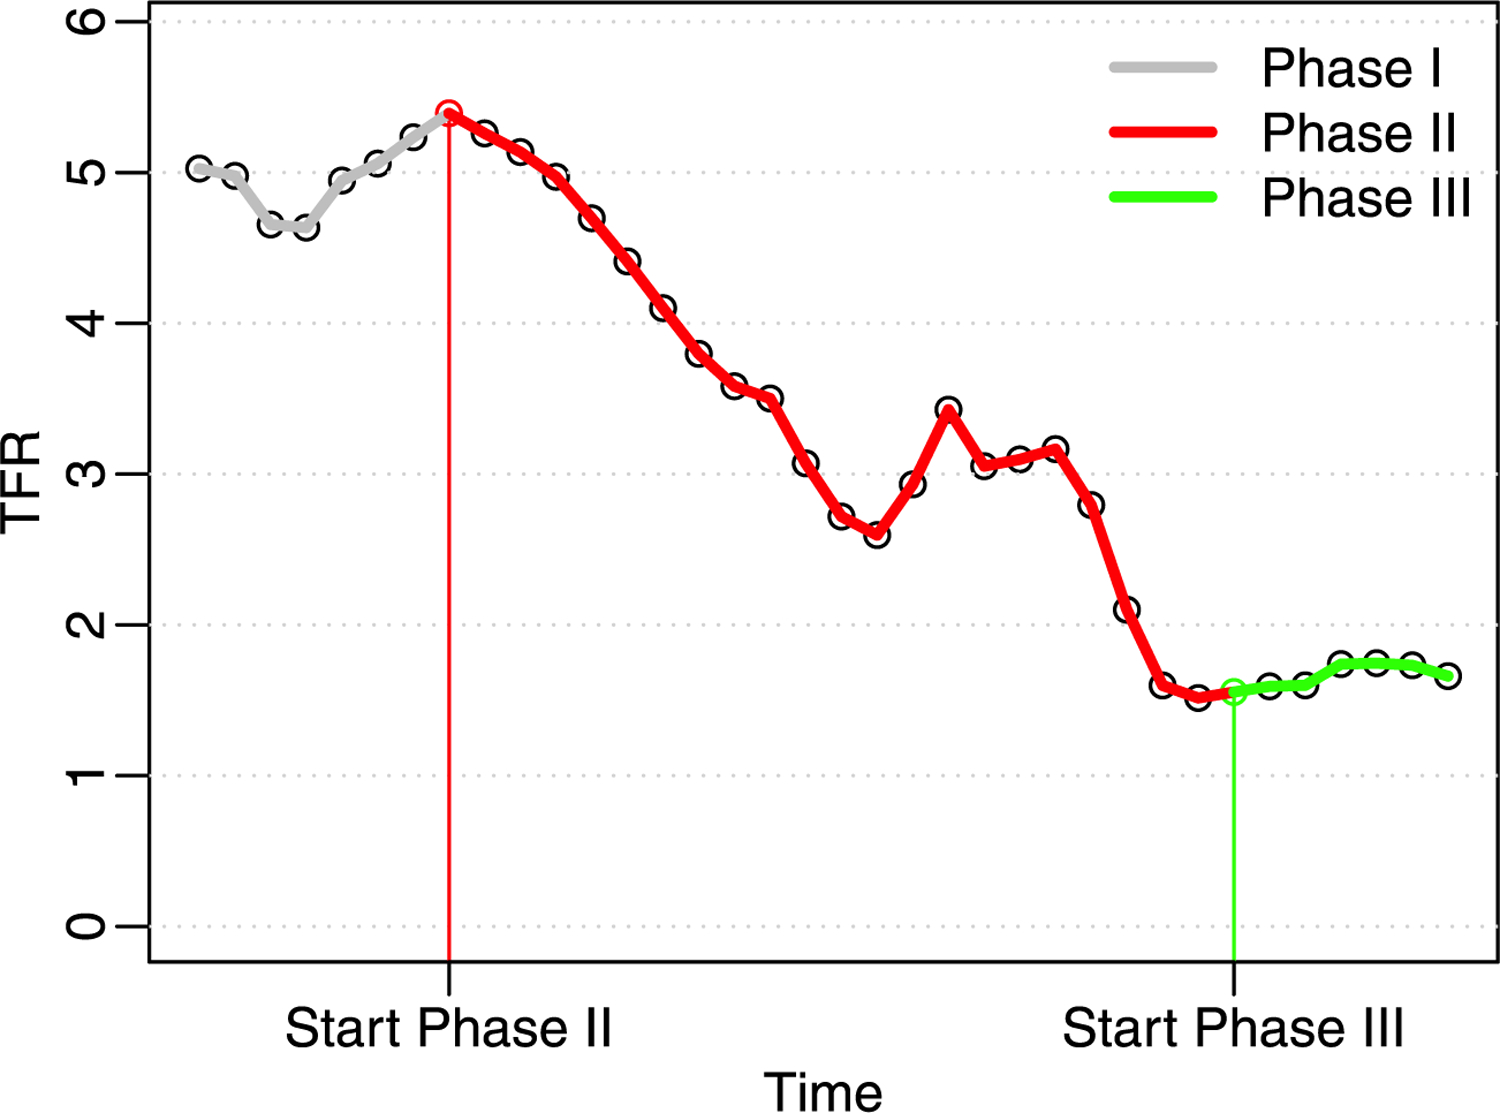
Fig. 1.

The three phases of the fertility transition, illustrated by historical data on TFR for the Netherlands from 1850 to 2020. Phase I, in grey, is the pre-transition phase, Phase II, in red, is the fertility transition from high to low fertility, which took about 100 years, and Phase III, in green, is the post-transition phase of leveling off and fluctuations.
