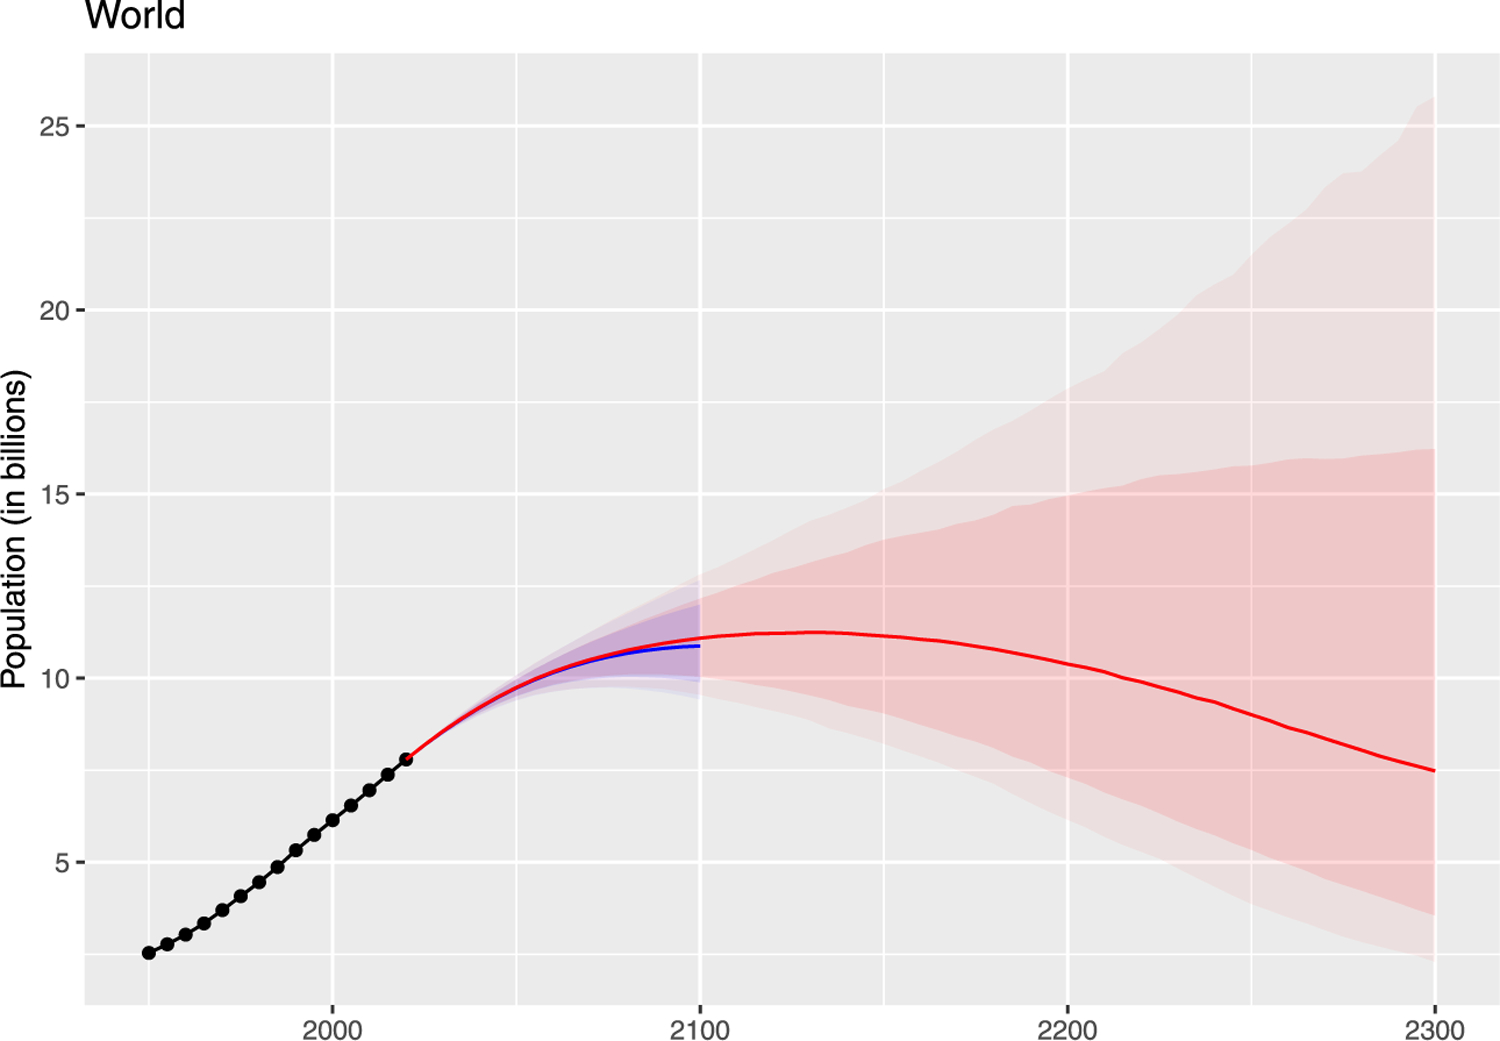
Fig. 10.

Predictive distribution of total world population to 2300, in billions. The circles show UN 2019 estimates of past population. The red curve shows our predictive median to 2300, the darker shaded area shows the 80% predictive interval, and the lighter shaded area shows the 95% predictive interval. The blue lines and shaded areas show the UN’s probabilistic forecasts of world population to 2100 (United Nations, 2019a).
