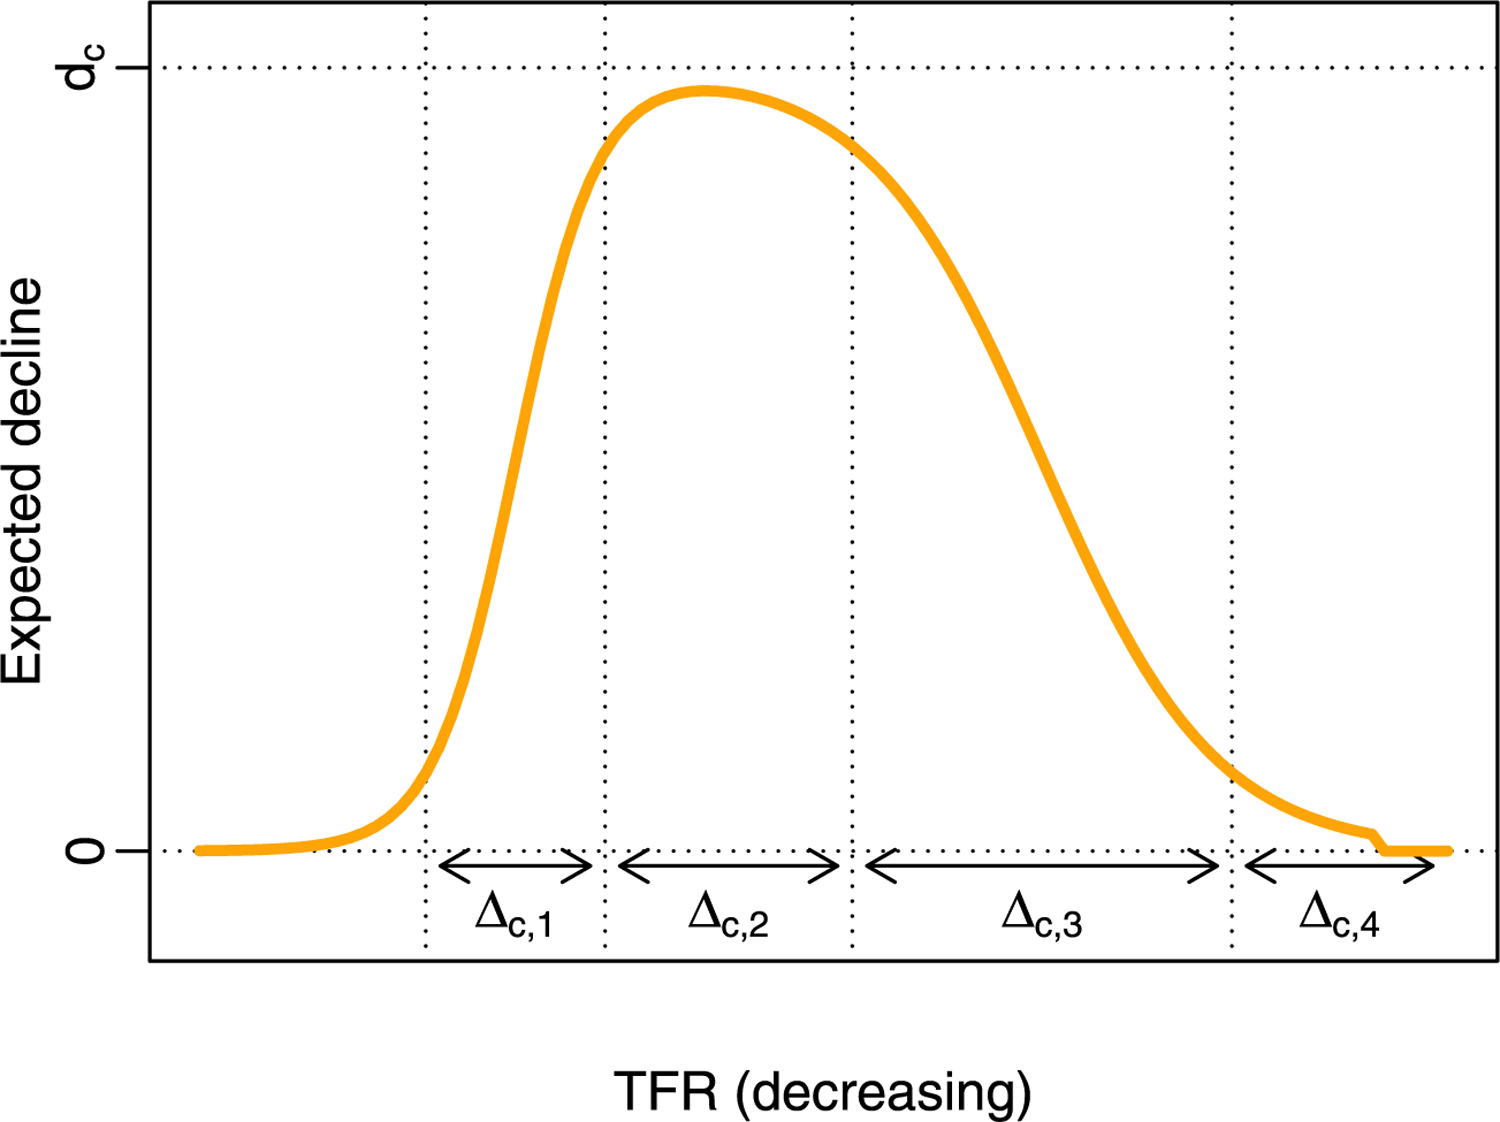
Fig. 2.

The double logistic function for modeling the expected change in the TFR, g(f ), as a function of the current TFR level, f. The TFR level is shown decreasing, since during the transition, the TFR is typically decreasing, and with this choice, time is generally moving from left to right. The parameters of the function are country-specific, denoted by the subscript c.
