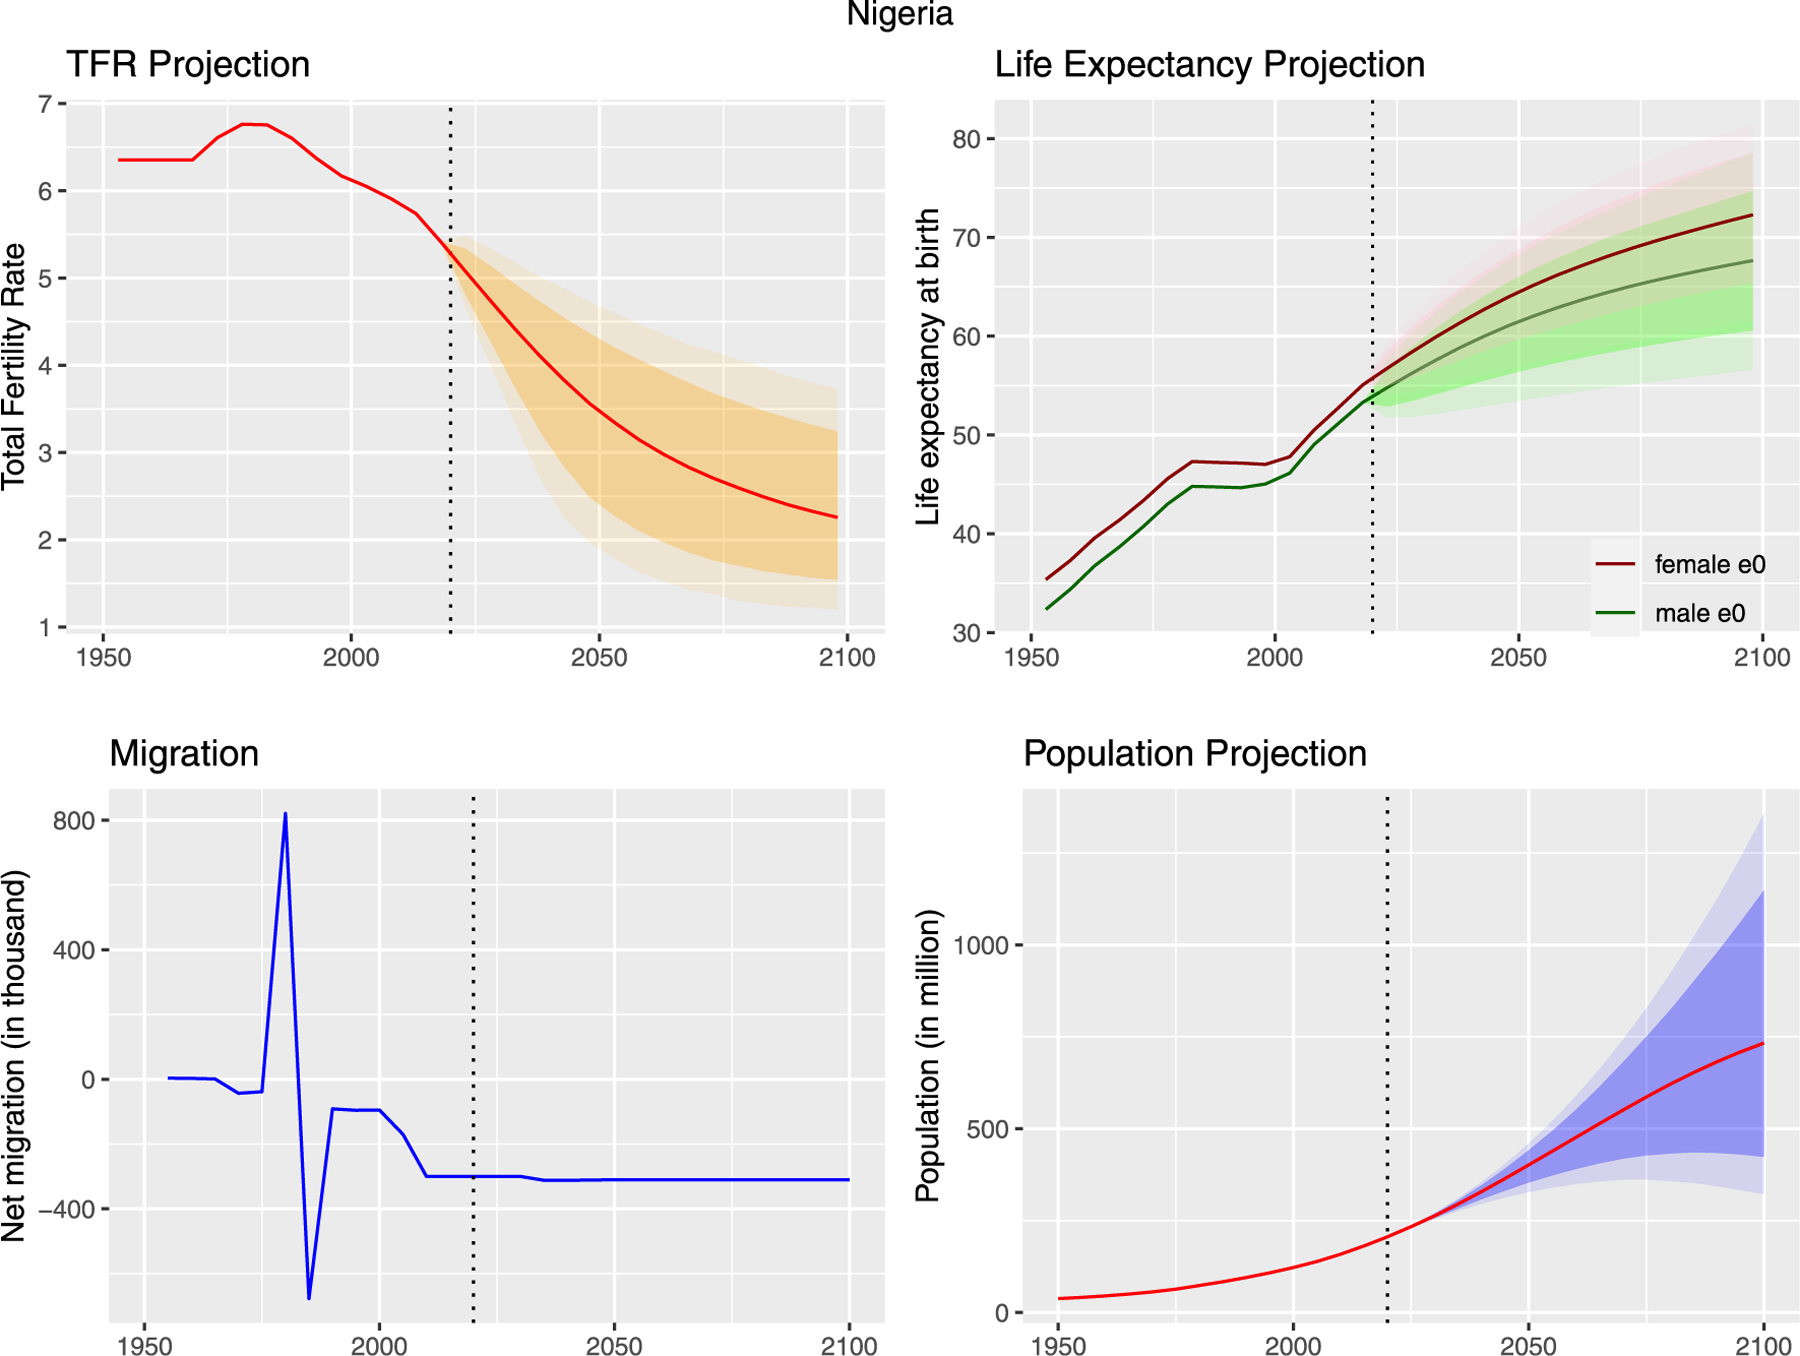
Fig. 5.

Probabilistic Bayesian projection of vital rates and population for Nigeria, 2020–2100, based on data from 1950–2020. (a) Top left: TFR projection. The red line shows the historical data and the median projection. The dark shaded area is the pointwise 80% forecast interval, and the light shaded area is the pointwise 95% forecast interval. (b) Top right: Life expectancy projection. The dark red line shows the historical data and the median projection for females, while the dark green line shows the same for males. The pink (green) dark/light shaded areas show the 80%/95% pointwise prediction intervals for females (males). (c) Bottom left: Net migration (in thousands), historical data and UN deterministic projection (United Nations, 2019a). (d) Bottom right: Population projection. The red line shows the historical data and the median projection. The dark/light shaded areas show the 80%/95% pointwise prediction intervals.
