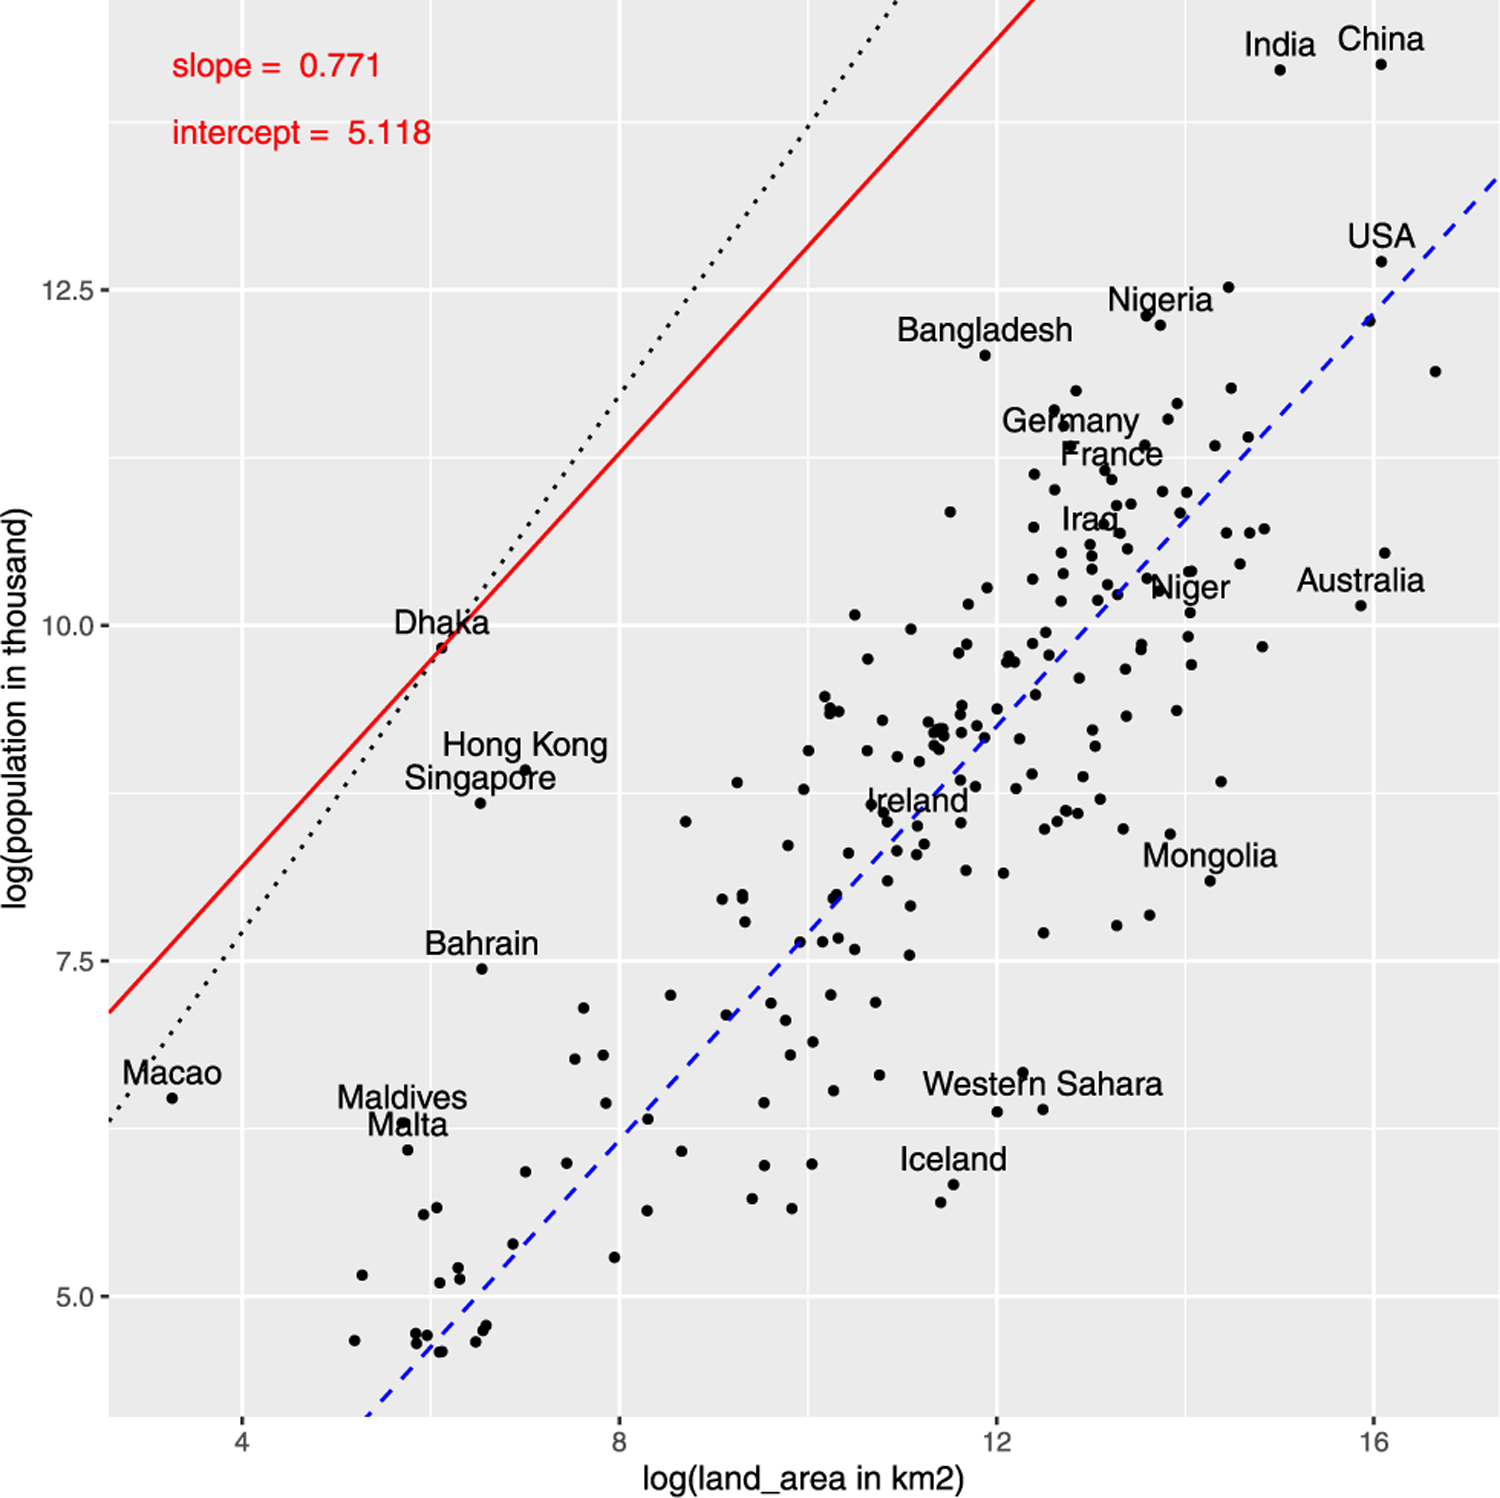
Fig. 8.

Log–log plot of population (in thousands) and land area (in km2). Black dots show the current data, while the blue dashed line is the regression line. The red line depicts our density constraint defined as log(population) < 5.118 + 0.771· log(land area). The black dotted line is a line with slope 1 that intersects Dhaka.
