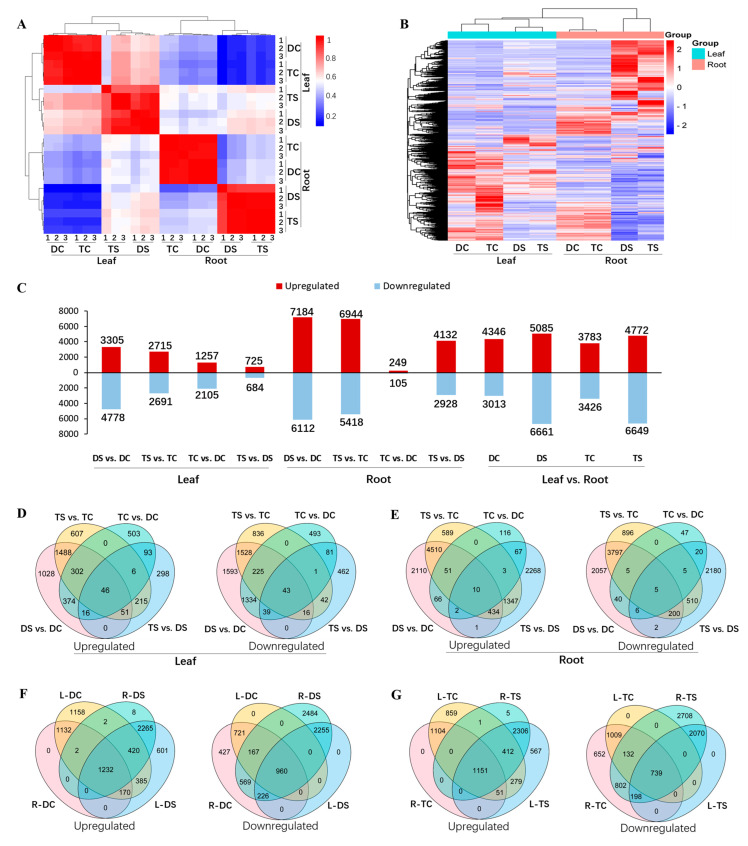
Figure 3.
Analysis data of next-generation sequencing (NGS) and third-generation sequencing (TGS)-derived DEGs in 93-11D and 93-11T with or without Na2CO3 treatment. (A) Hierarchical clustering of 24 samples according to the correlation coefficient between each sample. (B) Heat map hierarchical clustering of the overall gene expression. (C) Statistics of up- (in red) and down-regulated (in blue) DEGs in leaf, root and leaf vs. root for each pairwise comparison. Venn diagrams of up- and down-regulated DEGs in leaves (D), roots (E), leaf/root of diploid (F), and leaf/root of tetraploid (G). DC and TC represent diploid and tetraploid without stress, respectively; DS and TS represent diploid and tetraploid under Na2CO3 stress, respectively.

