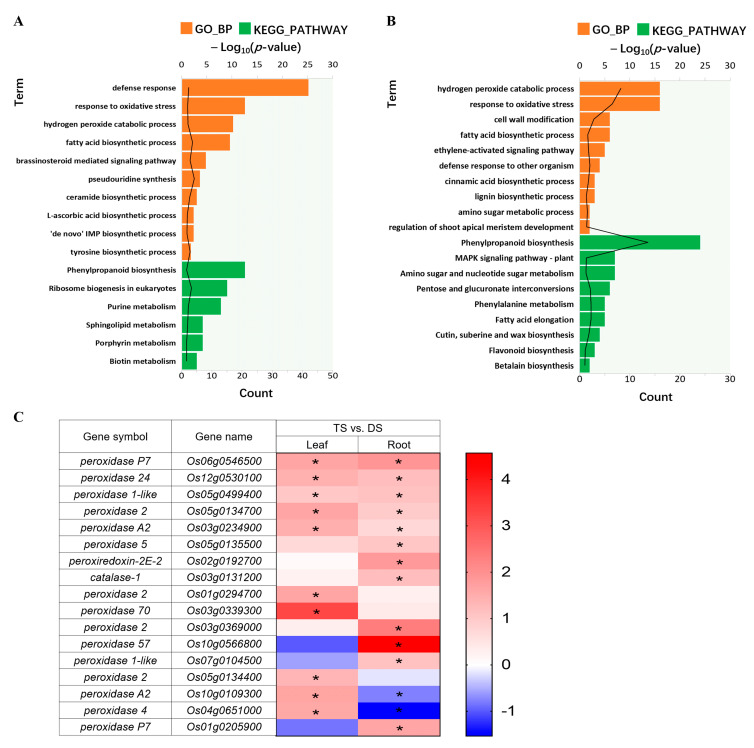
Figure 4.
GO functional and KEGG enrichment analysis for trend DEGs in 93-11D and 93-11T under Na2CO3 stress (TS vs. DS). Uptrend genes in roots (A), and leaves (B). The black line represents −log10 (p-value), refer to the upper scale; the number of enriched genes refer to the bottom scale; orange column represents GO_BP, green column represents KEGG pathway. GO: gene ontology; KEGG: Kyoto Encyclopedia of Genes and Genomes; BP: biological processes; DEGs: differentially expressed genes. (C) Heatmap of DEGs involved in peroxidase superfamily in leaves and roots of 93-11T relative to 93-11D (TS vs. DS). DS and TS represent diploid and tetraploid under Na2CO3 stress, respectively. The scale bar shows the value of log2 fold change (FC) with * p < 0.05.

