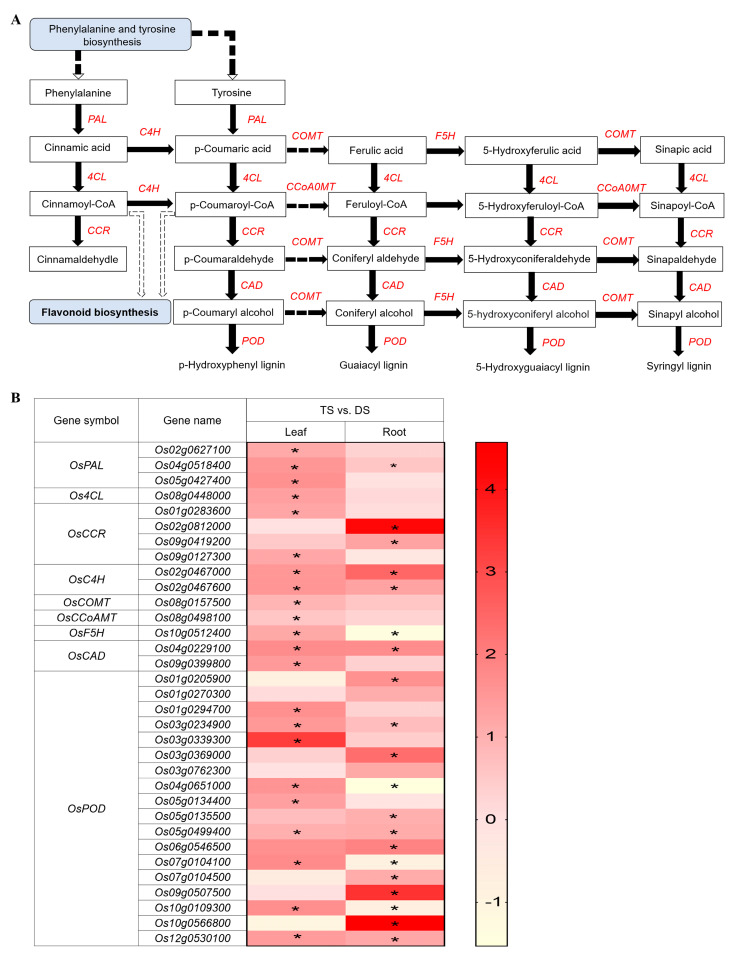
Figure 5.
Schematic view of genes involved in the lignin biosynthesis pathway and heatmap analysis of DEGs under Na2CO3 stress (TS vs. DS). (A) Overview of lignin biosynthesis pathway. The solid lines indicate direct interactions, and the dashed lines indicate indirect interactions. The arrows indicate stimulatory effects, whereas the T sharp symbol indicates inhibitory effects. (B) Heatmap analysis of DEGs enriched in the lignin biosynthesis pathway in leaves and roots. PAL, phenylalanine ammonia-lyase; 4CL, 4-coumarate-CoA ligase; CCR, cinnamoyl CoA reductase; C4H, trans-cinnamate 4-monooxygenase; COMT, caffeic acid 3-O-methyltransferase; CCoAMT, caffeoyl-CoA O-methyltransferase; F5H, ferulate-5-hydroxylase; CAD, cinnamyl alcohol dehydrogenase; POD, peroxidase. DS and TS represent diploid and tetraploid under Na2CO3 stress, respectively. Expression scores are shown as log2 fold change (FC) with * p < 0.05.

