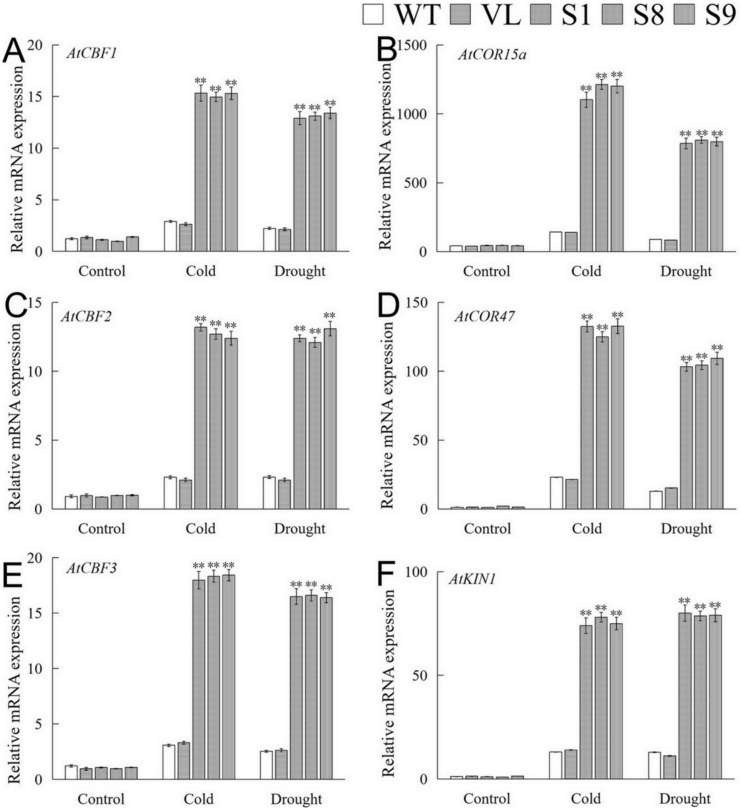
Figure 9.
Analysis of downstream gene expression of MbICE1 in WT, VL (vector line), and overexpression-MbICE1 under drought and cold stresses. Relative expression level of (A) AtCBF1; (B) AtCOR15a; (C) AtCBF2; (D) AtCOR47; (E) AtCBF3; (F) AtKIN1 by q-PCR. The value is the average of three repeats, and the standard deviation is represented by the error bar. The asterisk indicates the difference compared to WT (** p ≤ 0.01).

