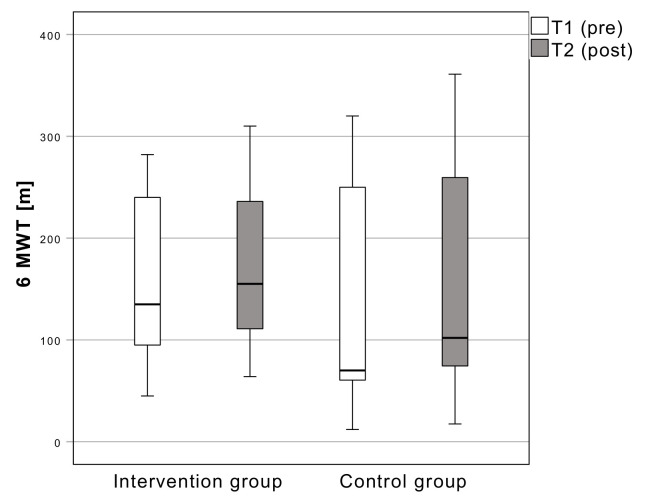
Figure 4.
Results of the distance walked in the 6 min walking test. Boxplots: Middle line: median; lower whisker: minimum value; upper whisker: maximum value; circles: Outliers (1.5 times interquartile range); p < 0.05; T1: measurement pre-intervention; T2: measurement post-intervention; Confidence interval: 95%; n = 25.

