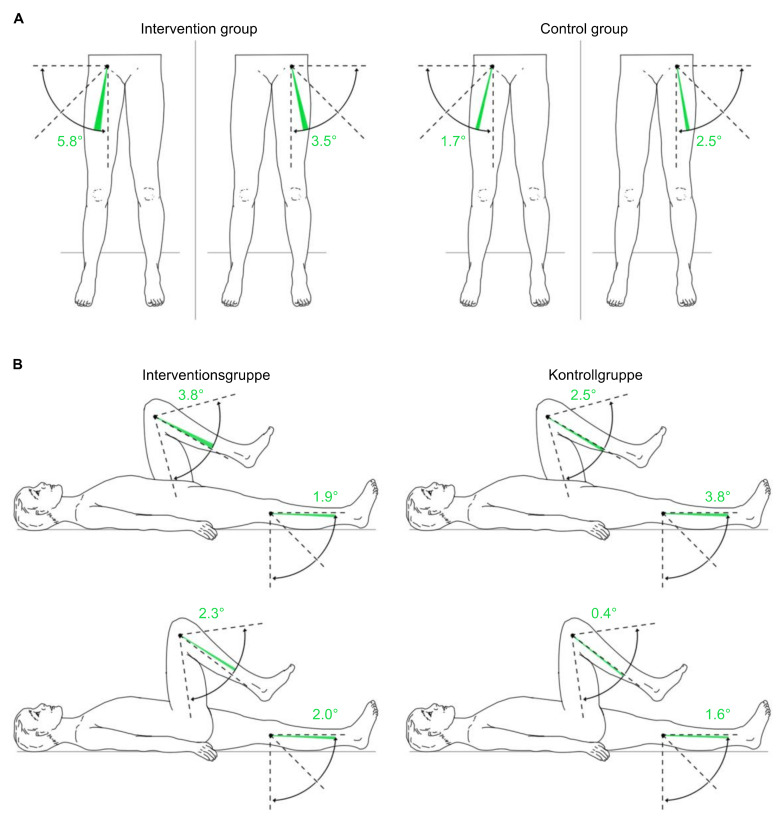
Figure 8.
Changes in passive range of motion of the hip and knee joints in the intervention group and control group from T1 to T2 on average. (A): hip joint on frontal plane; (B): knee joint on sagittal plane. Green area: positive delta results from T1 to T2; red area: negative delta results from T1 to T2; T1: measurement pre-intervention; T2: measurement post-intervention; n = 25. Source: author’s illustration.

