Figure 1.
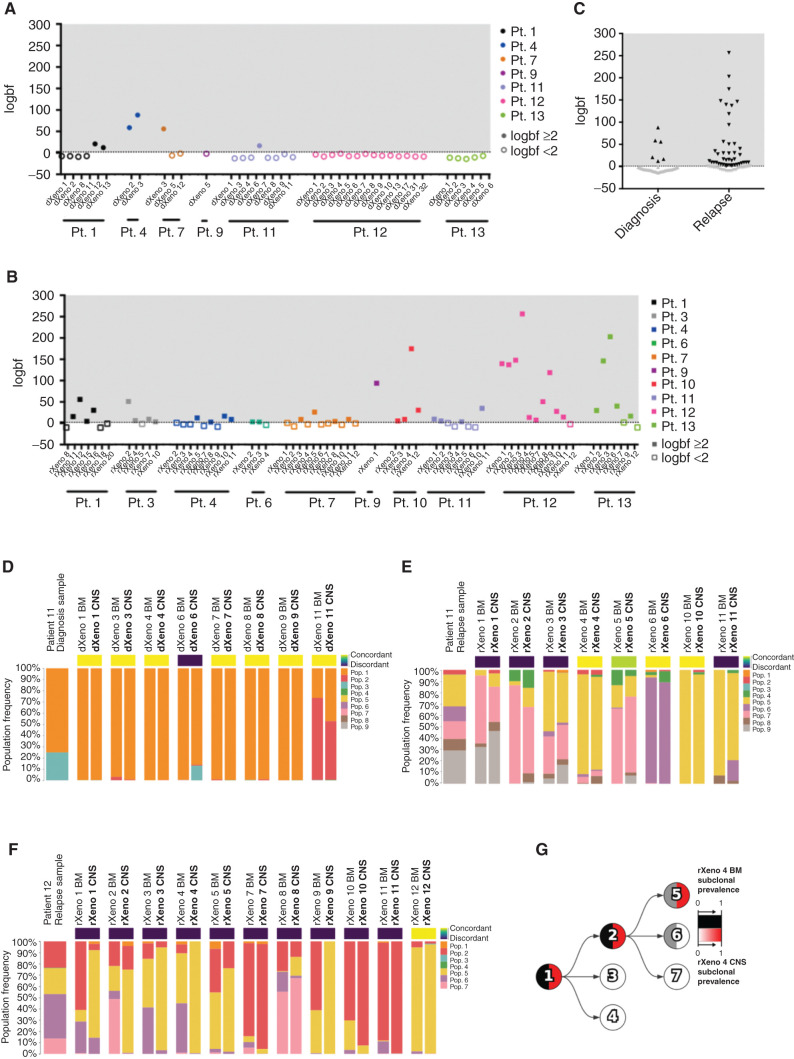
Differences in clonal composition of BM and CNS B-ALL xenograft engraftment. Mutational population genetic concordance or discordance of CNS blasts as determined using Bayes factors comparing the concordant model, whereby a mouse's BM/CNS samples share mutational population frequencies, with the discordant model, whereby a BM/CNS sample pair can have different mutational population frequencies. We show the logarithm of the Bayes factor (“logbf,” base 10) for the discordant model versus the concordant model for each sample pair in diagnosis xenografts (A; patient 1 n = 6 xenografts; patient 4 n = 2 xenografts; patient 7 n = 3 xenografts; patient 9 n = 1 xenograft; patient 11 n = 8 xenografts; patient 12 n = 14 xenografts; and patient 13 n = 6 xenografts) or relapse xenografts (B; patient 1 n = 7 xenografts; patient 3 n = 5 xenografts; patient 4 n = 9 xenografts; patient 6 n = 3 xenografts; patient 7 n = 11 xenografts; patient 9 n = 1 xenograft; patient 10 n = 4 xenografts; patient 11 n = 8 xenografts; patient 12 n = 11 xenografts; and patient 13 n = 7 xenografts). We used a threshold of logbf e2 to declare discordance for each mouse represented by the dotted line, reflecting that the discordant model was at least 100 times more likely than the concordant model. Filled-in data points have a logbf e2, whereas data points with no fill color have a logbf <2. C, Summary of concordance and discordance calls in diagnosis and relapse patient samples. Black data points have a logbf e2, whereas gray data points have a logbf <2. Mutational population frequencies were computed using Pairtree from patient 11 diagnosis (D; n = 8 xenografts), patient 11 relapse (E; n = 8 xenografts), and patient 12 relapse (F; n = 11 xenografts) samples. (Patient 12 diagnosis in Supplementary Fig. S1I.) G, Evolutionary trajectory of mutational populations for patient 12 is shown in a clone tree determined using Pairtree. Each mutational population is shown as a tree node, with edges indicating evolutionary descent. Each node shows the relative prevalence of mutational population lineages, consisting of mutational populations and their descendants, in BM (black, left half of node) and CNS (red, right half of node) within relapse xenograft 4 from patient 12. Pop., population; Pt., patient. dXeno represents xenografts generated from diagnosis patient samples, and rXeno represents xenografts generated from relapse patient samples.

