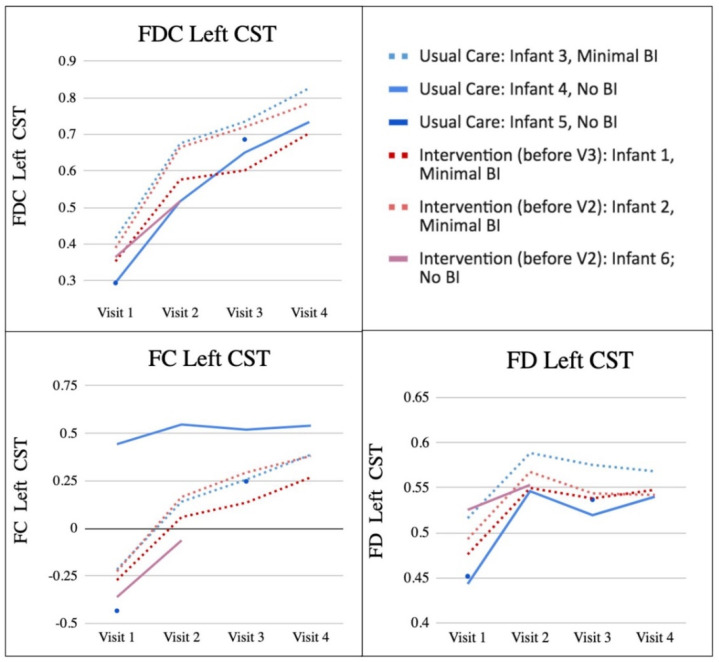
Figure 2.
FDC, FD and FC at Each Visit. Figure 2 shows individual infant metrics of FDC, FC, and FD at each visit (these are all expressed in arbitrary units). Usual care infants are coded blue and intervention infants are coded red. Infants with minimal brain injury have dashed lines, and infants with no brain injury have solid lines. BI = brain injury, FD = fibre density, FC = fibre bundle cross-section, FDC = combined fibre density and bundle cross-section, CST = corticospinal tract.

