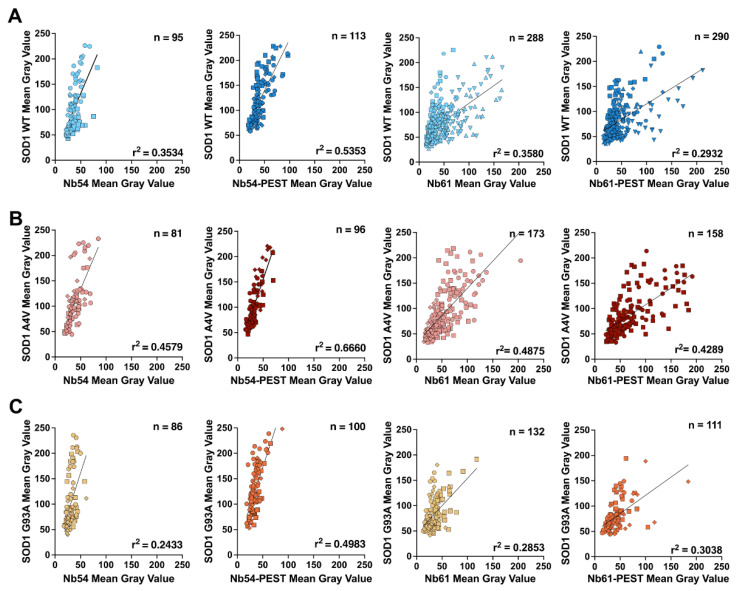
Figure 3.
Exogenous expression levels of SOD1-myc and nanobody proteins are positively correlated in cellulo. Linear-regression analyses of SOD1 and nanobody signal intensity. For all conditions there is a moderate positive correlation, with SOD1 and Nb54-PEST co-transfections demonstrating the strongest correlations. (A) HEK293T cells co-transfected with SOD1 WT and Nb54, Nb54-PEST, Nb61, or Nb61-PEST. (B) HEK293T cells co-transfected with SOD1 A4V and Nb54, Nb54-PEST, Nb61, or Nb61-PEST. (C) HEK293T cells co-transfected with SOD1 G93A and Nb54, Nb54-PEST, Nb61, or Nb61-PEST. For (A–C): Data are pooled from three biological replicates with the exception of SOD1 WT co-transfected with Nb61 and Nb61-PEST, which are pooled from six biological replicates. Each point represents one cell; each symbol denotes a specific biological replicate. The r2 values reflect the fit of experimental data to the depicted regression line. Increasing r2 values indicate that the SOD1 and Nb signal intensities are positively correlated.

