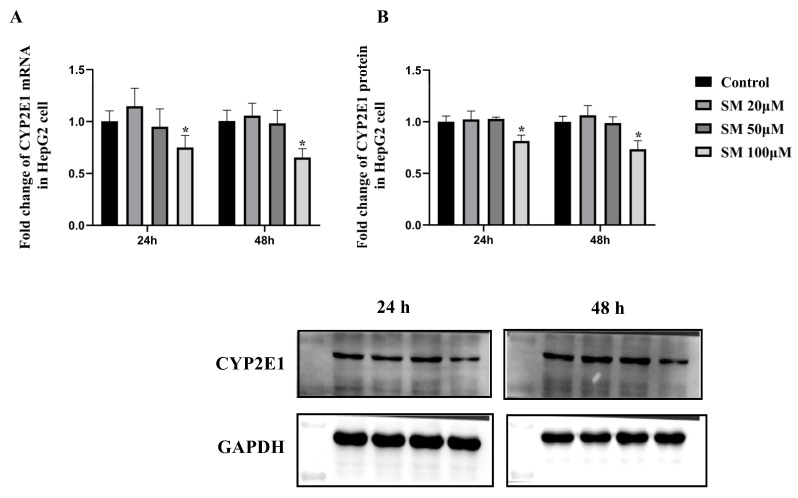
Figure 4.
The mRNA expression (A) and protein expression (B) levels of CYP2E1 in HepG2 cells after 24 h or 48 h of treatment with different concentrations of SM. The mRNA and protein expression levels of CYP2E1 were normalized to those of GAPDH. The data are presented as the means ± SDs, n = 3. * p < 0.05 compared with the control group.

