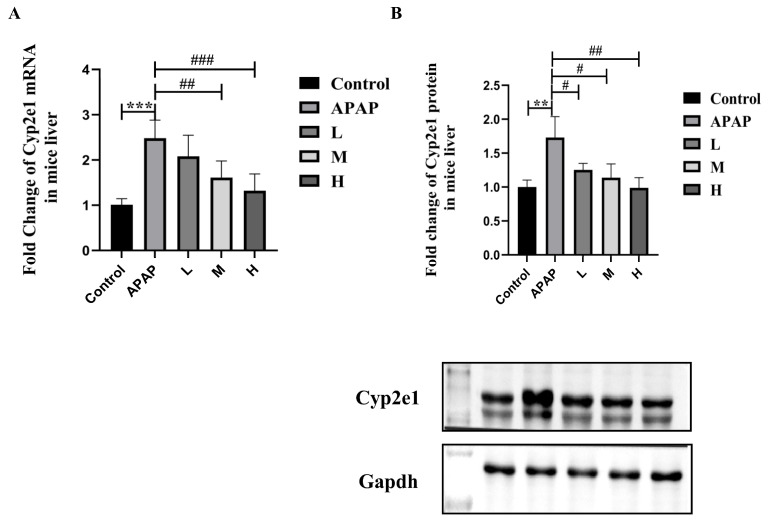
Figure 7.
The mRNA expression (A) and protein expression (B) of Cyp2e1 in normal (pre-treated with solvent) and ALI (pre-treated with SM) mice. Series dosages of 35, 50, and 65 mg/kg were noted as L, M, and H, respectively. The mRNA and protein expression levels of Cyp2e1 were normalized to Gapdh. The data are presented as the means ± SDs, n = 6. ** p < 0.01, *** p < 0.001 compared with the control group; # p < 0.05, ## p < 0.01, ### p < 0.001 compared with the APAP group.

