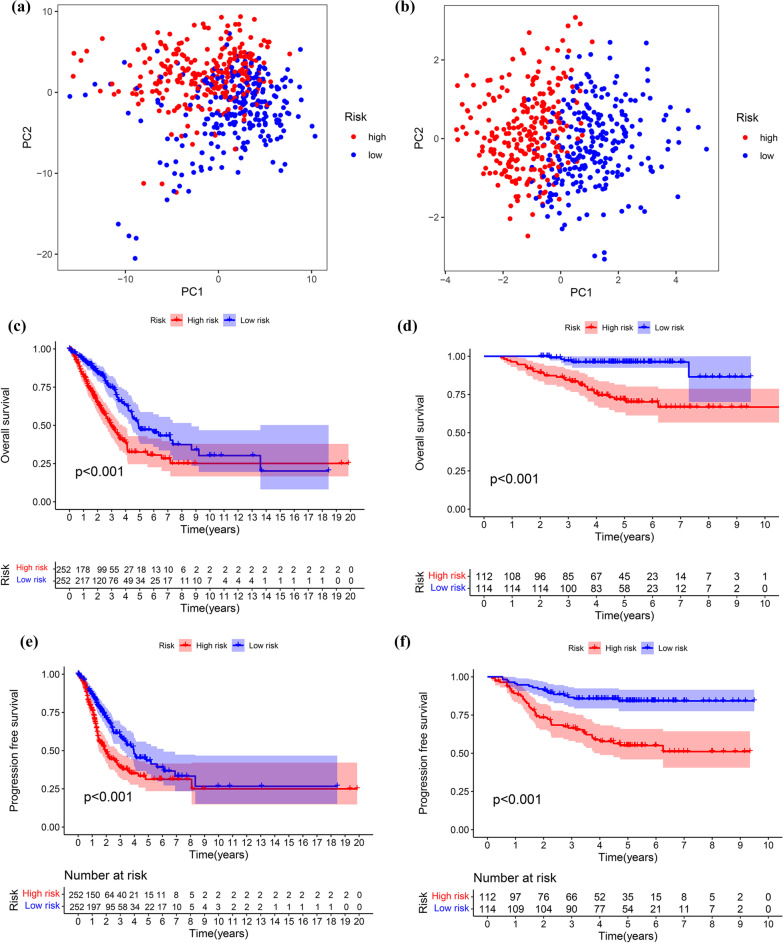
Fig. 4.
The prognostic value of risk score model. a Principal component analysis depended basically on all genes involved in fatty acid metabolism in LUAD; b Principal component analysis based upon 5 fatty acid metabolism-associated genes from risk score prognostic model; c Kaplan–Meier curves for the overall survival of patients between the higher-risk and lower-risk groups in the TCGA cohort; d Kaplan–Meier curves for the overall survival of patients between the higher-risk and lower-risk groups in the GSE31210 dataset; e Kaplan–Meier curves for the progression free survival of patients between the higher-risk and lower-risk groups in the TCGA cohort; f Kaplan–Meier curves for the progression free survival of patients between the higher-risk and lower-risk groups in the GSE31210 dataset

