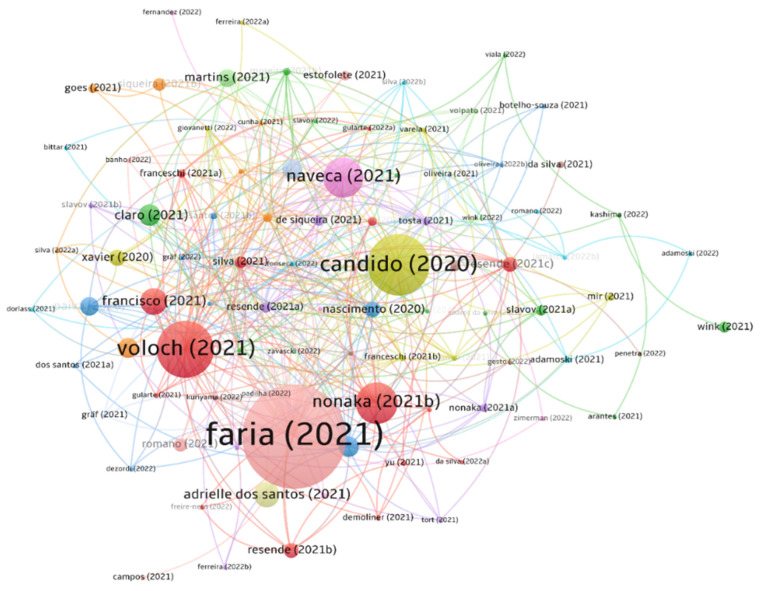
Figure 3.
Citation map for articles cross-citations. Connectors indicate article citations. The circle size is weighted by the citation number of each study in the literature up to 25 October 2022. Thirteen clusters were found, and are indicated by different colours. Metadata is available in Table S5 [20,21,22,23,24,25,27,28,29,30,31,32,33,34,35,36,37,38,39,40,41,42,44,45,46,47,48,49,50,51,52,53,54,56,57,58,59,60,61,63,64,65,66,67,68,69,70,72,72,73,74,75,76,77,78,79,80,81,83,84,85,86,87,88,89,90,91,93,94,95,96,97,98,99,100,101,102,104,105,106,107,108,109,110,111,112,114,116,118,119,120,121,122,123].

