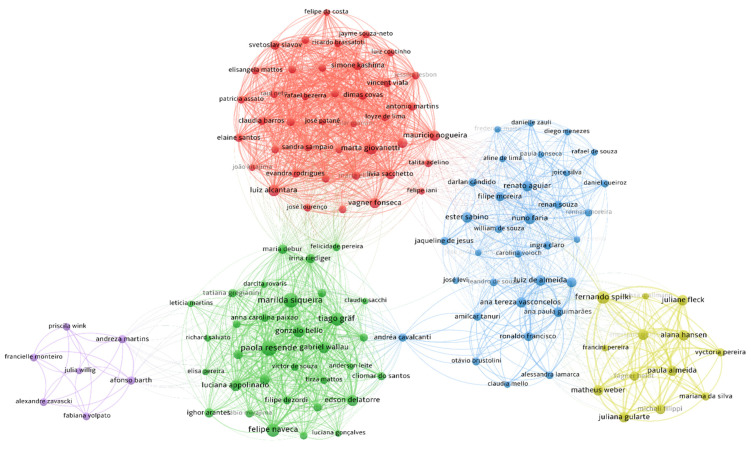
Figure 4.
Author co-authorship map. Authors with at least four articles were included (n = 127 out of 1190). Connectors indicate co-authorships. Circle sizes were weighted by the number of publications included in the systematic review. Five clusters were found, and are characterised by different colours. Metadata is available in Table S6.

