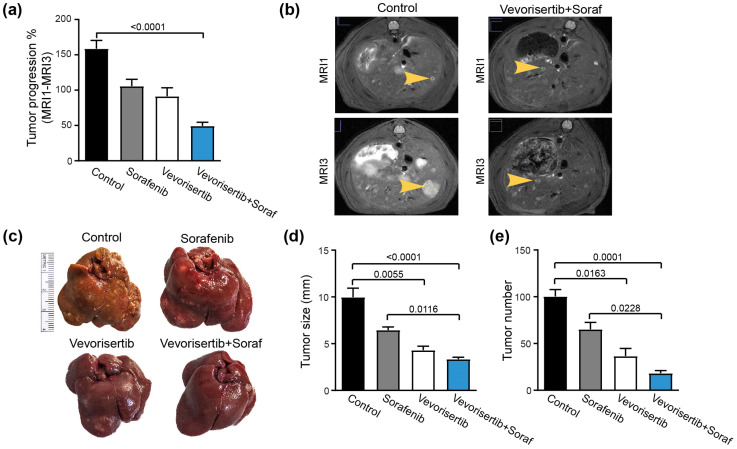
Figure 2.
Effect of vevorisertib and vevorisertib + sorafenib treatment on tumor progression. (a) Tumor progression assessment calculated as tumor size (MRI3–MRI1)/MRI1 and (b) representative images of abdominal MRI1 and MRI3 scans of control and vevorisertib + sorafenib treated rats. (c) Representative images of liver of control, sorafenib, vevorisertib and vevorisertib + sorafenib treated group. (d) Macroscopic examination of livers with an assessment of tumor size calculated as average diameter of the five largest tumors. (e) Macroscopic examination of tumor number at the surface of the livers. n = 7/group, values are mean ± SE. Kruskal–Wallis test was used for multiple comparisons.

