Figure 3.
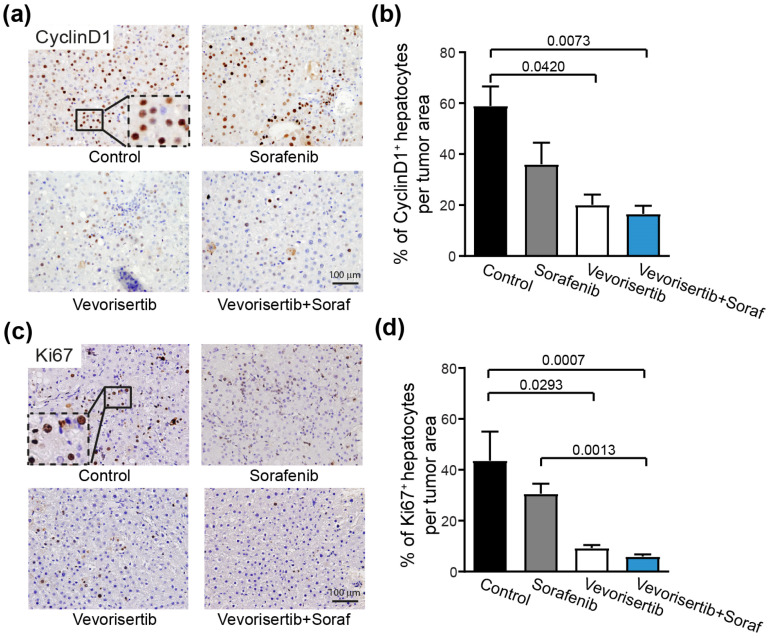
Effect of vevorisertib and vevorisertib + sorafenib treatment on tumor cell proliferation. (a) Representative images of nuclear Cyclin D1 staining of control, sorafenib, vevorisertib and vevorisertib + sorafenib treated group, 20× magnification and (b) quantification of % of Cyclin D1 positive hepatocytes per tumor area. (c) Representative images of nuclear Ki67 staining of control, sorafenib, vevorisertib and vevorisertib + sorafenib treated group, 20× magnification and (d) quantification of % of Ki67 positive hepatocytes per tumor area. n = 7/group, values are mean ± SE. Kruskal–Wallis test was used for multiple comparisons.

