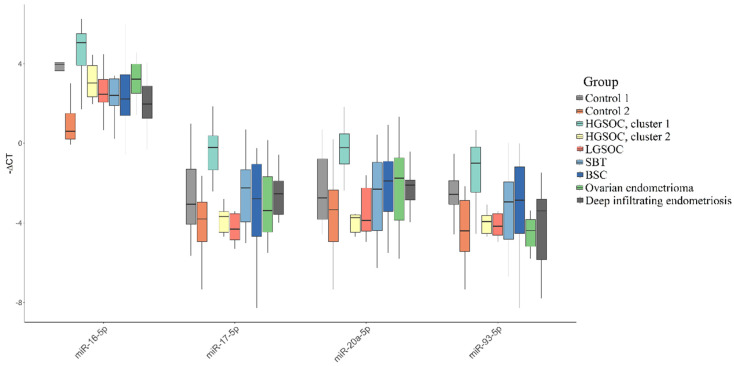
Figure 6.
Comparative analysis of miRNA expression level in blood plasma samples of apparently healthy women, patients with different histotypes of serous ovarian tumors, endometriosis by quantitative real-time PCR. Data are presented as the median of the “-∆Ct” values, quartiles Q1 and Q3, and outliers as the dots.

