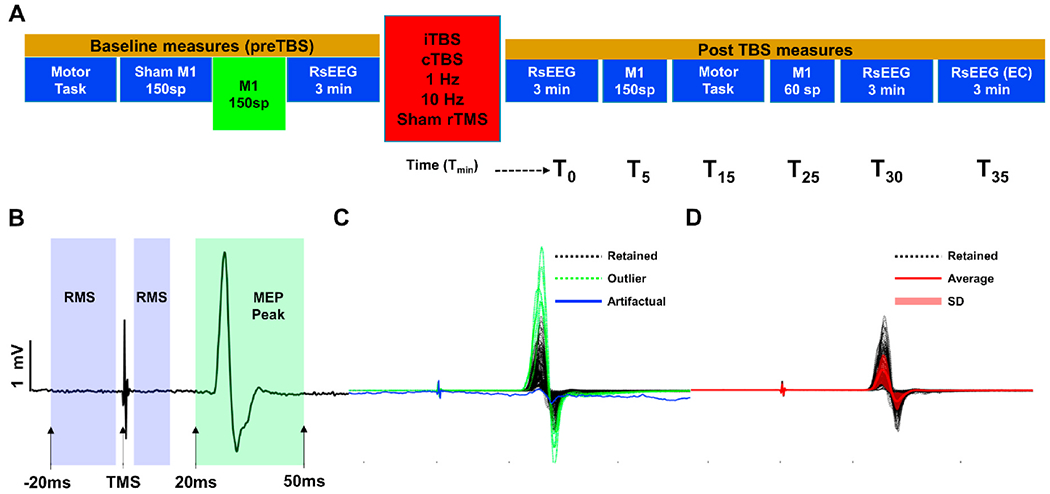
Fig. 1.

Study Design and Preprocessing of MEPs. A: Experimental design of the study protocol MEP data were taken from. Baseline M1 stimulation blocks (green block) with 150 single pulse TMS were used for all analyses. B: Representative MEP time series. Root mean square (RMS) is computed from purple shaded windows to identify artifactual trials and trials with high baseline EMG activity. MEP amplitude is computed as the absolute difference between signal maximum and minimum within the green shaded window. C: 150 MEP trials from a representative subject. Purple colored time series show rejected trials based on RMS calculation and green colored time series show outlier trials rejected based on standard deviation of MEP amplitudes. D: Retained trials after rejecting artifactual and outlier trials in C. Red colored time series show average MEP response of the block and red shaded regions represent standard deviation (1unit) of MEPs. (For interpretation of the references to color in this figure legend, the reader is referred to the Web version of this article.)
